Download
1 / 25
260 likes | 582 Vues
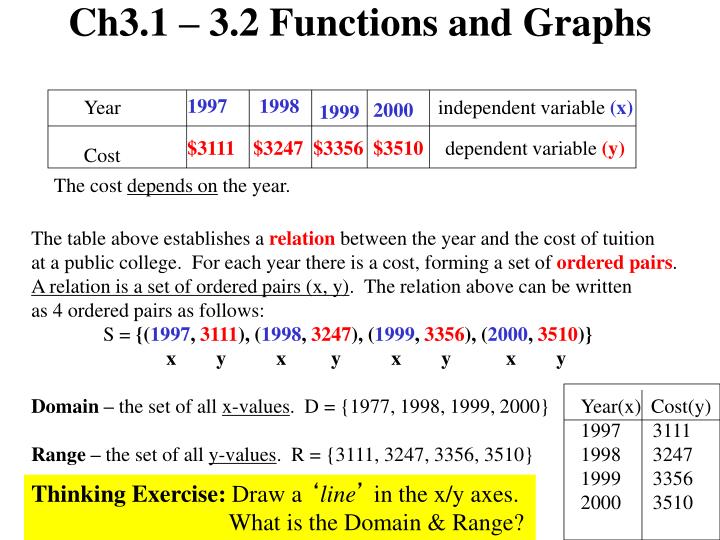
Ch3.1 – 3.2 Functions and Graphs. 1997. 1998. Year. independent variable (x). 2000. 1999. $3111. $3247. $3356. $3510. dependent variable (y). Cost. The cost depends on the year. The table above establishes a relation between the year and the cost of tuition

E N D
Ch3.1 – 3.2 Functions and Graphs 1997 1998 Year independent variable (x) 2000 1999 $3111 $3247 $3356 $3510 dependent variable (y) Cost The cost depends on the year. The table above establishes a relation between the year and the cost of tuition at a public college. For each year there is a cost, forming a set of ordered pairs. A relation is a set of ordered pairs (x, y). The relation above can be written as 4 ordered pairs as follows: S = {(1997, 3111), (1998, 3247), (1999, 3356), (2000, 3510)} x y x y x y x y Domain – the set of all x-values. D = {1977, 1998, 1999, 2000} Range – the set of all y-values. R = {3111, 3247, 3356, 3510} Year(x) Cost(y) 1997 3111 1998 3247 1999 3356 2000 3510 Thinking Exercise: Draw a ‘line’ in the x/y axes. What is the Domain & Range?
Input x y – Profit in thousands of $$ (Dependent Var) x - Years in business (Independent Var) Functions & Linear Data Modeling Function f (6,0) Output y=f(x) y intercept x intercept (0,-3) • Equation: y = ½ x – 3 • Function: f(x) = ½ x – 3 • x y = f(x) • 0 -3 f(0) = ½(0)-3=-3 • -2 f(2) = ½(2)-3=-2 • 0 f(6) = ½(6)-3=0 • 8 1 f(8) = ½(8)-3=1 • A function has exactly one output value (y) • for each valid input (x). • Use the vertical line test to see if an equation is • a function. • If it touches 1 point at a time then FUNCTION • If it touches more than 1 point at a time then • NOT A FUNCTION.
Diagrams of Functions A function is a correspondence fro the domain to the range such that each element in the domain corresponds to exactly one element in the range. f • Function: f(x) = ½ x – 3 • x y = f(x) • 0 -3 f(0) = ½(0)-3=-3 • -2 f(2) = ½(2)-3=-2 • 0 f(6) = ½(6)-3=0 • 8 1 f(8) = ½(8)-3=1 -3 0 2 -2 6 0 8 1 f 4 5 6 1 2 3 4 5 A function NOT a function
How to Determine if an equation is a function Graphically: Use the vertical line test Symbolically/Algebraically: Solve for y to see if there is only 1 y-value. Example 1: x2 + y = 4 y = 4 – x2 For every value of x there Is exactly 1 value for y, so This equation IS A FUNCTION. Example 2: x2 + y2 = 4 y2 = 4 – x2 y = 4 – x2 or y = - 4 – x2 For every value of x there are 2 possible values for y, so This equation IS NOT A FUNCTION.
Are these graphs functions? Use the vertical line test to tell if the following are functions: y = x3 y = x2 Y-axis Symmetry x = y2 X-axis Symmetry Origin Symmetry
More on Evaluation of Functions f(x) = x2 + 3x + 5 Evaluate: f(2) f(2) = (2)2 + 3(2) + 5 f(2) = 4 + 6 + 5 f(2) = 15 Evaluate: f(x + 3) f(x + 3) = (x + 3)2 + 3 (x + 3) + 5 f(x + 3) = (x + 3)(x + 3) + 3x + 9 + 5 f(x + 3) = (x2 + 3x + 3x + 9) + 3x + 14 f(x + 3) = (x2 + 6x + 9) + 3x + 14 f(x + 3) = x2 + 9x + 23 Evaluate: f(-x) f (-x) = (-x)2 + 3( -x) + 5 f (-x) = x2 - 3x + 5
More on Domain of Functions • A function’s domain is the largest set of real numbers for which the value f(x) • is a real number. So, a function’s domain is the set of all real numbers • MINUSthe following conditions: • specific conditions/restrictions placed on the function • Bounds relating to real-life data modeling • (Example: y = 7x, where y is dog years and x is dog’s age) • values that cause division by zero • values that result in an even root of a negative number • What is the domain the following functions: • f(x) = 6x 2. g(x) = 3x + 12 3. h(x) = 2x + 1 • x2 – 9
Definition of a Difference Quotient The expression below is called the difference quotient. (This expression will become useful later, so…….Stay Tuned ….) Example function: f(x) = x2 + 3x + 5 f(x + h) = (x + h )2 + 3( x + h ) + 5 = (x + h)(x + h) + 3x + 3h + 5 = x2 + 2xh + h2 + 3x + 3h + 5 Challenge yourself! For the same function f(x), find:
Sum, Difference, Product, and Quotient of Functions Let f and g be two functions. The sum of f + g, the differencef – g, the productfg, and the quotientf /g are functions whose domains are the set of all real numbers common to the domains of f and g, defined as follows: Sum: (f + g)(x) = f (x)+g(x) Difference: (f – g)(x) = f (x) – g(x) Product: (f • g)(x) = f (x) • g(x) Quotient: (f / g)(x) = f (x)/g(x), provided g(x) does not equal 0 Example: Let f(x) = 2x+1 and g(x) = x2-2. f+g = 2x+1 + x2-2 = x2+2x-1 f-g = (2x+1) - (x2-2)= -x2+2x+3 fg = (2x+1)(x2-2) = 2x3+x2-4x-2 f/g = (2x+1)/(x2-2)
Adding & Subtracting Functions If f(x) and g(x) are functions, then: (f + g)(x) = f(x) + g(x) (f – g)(x) = f(x) – g(x) Examples:f(x) = 2x + 1 and g(x) = -3x – 7 Method1 Method1 (f + g)(4) = 2(4) + 1 + -3(4) – 7 (f – g)(6) = 2(6) + 1 – [-3(6) – 7] = 8 + 1 + -12 – 7 = 12 + 1 - [-18 – 7] = 9 + -19 = 13 - [-25] = -10 = 13 + 25 Method2 Method2 = 38 (f + g)(4) = 2x + 1 + -3x – 7 (f + g)(6) = 2x + 1 - [-3x – 7] = -x – 6 = 2x + 1 + 3x + 7 = -4 – 6 = 5x + 8 = - 10 = 5(6) + 8 = 30 + 8 = 38 Adding/subtracting also extends to non-linear functions you will see in a subsequent chapter.
Function Practice • 1) y = 9 Domain? = _____________ • 3 – 8x • 2) X = y2 (Is y a function of x?) _______________ • Y = x9 (Is y a function? ________ Domain? _________) • F(x) = x2 – 3x + 7 and g(x) = -3x2 -7x + 7 • (f + g)(x) = _____________________________ • (f – g)(x) = _____________________________
More Practice f(x) = 2x2 x4 + 1 • Is the point (-1, 1) on the graph of f? • If x = 2, what is f(x)? What point is on the graph of f? • If f(x) = 1, what is x? What point(s) are on the graph of f? • What is the domain of f? • List the x-intercepts, if any, of the graph of f. • List the y-intercept, if there is one, of the graph of f.
Application: Golf A golf ball is hit with an initial velocity of 130 feet per second at an inclination of 45 degrees to the horizontal. In physica, it is established that the height h of the golf ball is given by the function: h(x) = -32x2 / 1302 + x Where x is horizontal distance that the golf ball has traveled. • Determine the height of the golf ball after it has traveled 100 feet • What is the height after it has traveled 300 feet? • What is the height after it has travelled 500 feet? • How far was the golf ball hit? • Use a Ti-84 to graph the function h=h(x) • Use a Ti-84 to determine the distance that the ball has traveled when the hieght of the ball is 90 feet. • Create a TABLE with TblStart = 0 and ΔTbl = 25. To the nearest 25 feet, how far does the ball travel before it reaches a maximum height? What is the maximum height? • Adjust the value of ΔTbl until you determine the distance, to within 1 foot, that the ball travels before it reaches a maximum height.
3.3 Even/Odd Functions Revisited Y-Axis Symmetry even functions f (-x) = f (x) For every point (x,y), the point (-x, y) is also on the graph. Test for symmetry: Replace x by –x in equation. Check for equivalent equation. Origin Symmetry odd functions f (-x) = -f (x) For every point (x, y), the point (-x, -y) is also on the graph. Test for symmetry: Replace x by –x , y by –y in equation. Check for equivalent equation. y = x3 y = x2 EVEN Try these without Using a graph: y = 3x2 – 2 y = x2 + 2x + 1 ODD Test -y = (-x)3 -y = -x3 y = x3 Test y = (-x)2 y = x2
(x2, f (x2)) (x1, f (x1)) (x1, f (x1)) (x2, f (x2)) (x1, f (x1)) (x2, f (x2)) Increasing f (x1) < f (x2) Decreasing f (x1) > f (x2) Constant f (x1) = f (x2) A function is increasing on an interval if for any x1, and x2 in the interval, where x1 < x2, then f (x1) < f (x2). A function is decreasing on an interval if for any x1, and x2 in the interval, where x1 < x2, then f (x1) > f (x2). A function is constant on an interval if for any x1, and x2 in the interval, where x1 < x2, then f (x1) = f (x2). Increasing, Decreasing, and Constant Functions
a. b. 5 5 4 4 3 3 2 1 1 -5 -4 -3 -2 -1 1 2 3 4 5 -5 -4 -3 -2 -1 1 2 3 4 5 -1 -1 -2 -2 -3 -3 -4 -4 -5 -5 More Examples • Observations • Decreasing on the interval (-oo, 0) • Increasing on the interval (0, 2) • Decreasing on the interval (2, oo). Observations a. Two pieces (a piecewise function) b. Constant on the interval (-oo, 0). c. Increasing on the interval (0, oo). Challenge Yourself: What might be the definition of the piecewise function for this graph? (You will learn about these Later. Can you guess what it might be?)
f(x) = sin (x) • x y • 0 0 • /2 1 • 0 3/2 -1 2 0 90 270 180 360 Relative (local) Min & Max The point at which a function changes its increasing or decreasing behavior is called a relative minimum or relative maximum. y 2 (90, f(90)) f(90), or 1, is a local max 1 x 0 -1 (270, f(270)) f(270), or -1, is a local min -2 A function value f(a) is a relative maximum of f if there exists an open interval about a such that f(a) > f(x) for all x in the open interval. A function value f(b) is a relative minimum of f if there exists an open interval about b such that f(b) < f(x) for all x in the open interval.
y - $$ in thousands x Yrs Slope & Average Rate of Change y = x2 - 4x + 4 y = ½ x – 3 (6,0) (0,-3) Non-linear equations do not have a constant rate of change. But you can Find the average rate of change from x1 to x2 along a secant to the graph. f(x2) – f(x1) x2 – x1 The slope of a line may be interpreted as the rate of change. The rate of change for a line is constant (the same for any 2 points) y2 – y1 x2 – x1 See Page 236 for more examples.
Application: Medicine The concentration C of a medication in the bloodstream t hours after being administered is given by: C(t) = -.002x4 + .039t3 - .285t2 + .766t + .085 • After how many hours will the concentration be highest? • A woman nursing a child must wait until the concentration is below .5 before she can feed him. After taking the medication, how long must she wait before feeding her child?
y = x1/3 y = c y = x y = |x| y = x2 y = x3 y = x x x x x x x x 3.4 Library of Functions/Common Graphs y = 1/x Can you graph : y = ½ (x + 2)3 + 2
Step Function Application Example y = int(x) or y = [[x]] (Greatest Integer Function) f(x) = int(x) y – Tax (+) or Refund (-) in thousands of $$ x – Income in $10,000’s • Find: • f (1.06) • f (1/3) • f (-2.3) • What other applications of the step function can you think of?
Piecewise Functions A function that is defined by two (or more) equations over a specified domain is called a piecewise function. f(x) = x2 + 3 if x < 0 5x + 3 if x>=0 f(-5) = (-5)2 + 3 = 25 + 3 = 28 f(6) = 5(6) + 3 = 33 See Page 247 for more examples
3.5 Transformation of Functions A transformation of a graph is a change in its position, shape or size. For a given function, y = f(x) y = f(x) +c [shift up c] y = f(x) – c [shift down c] y = f(x + c) [shift left c] y = f(x – c) [shift right c] y = -f(x) [flip over x-axis] y = f(-x) [flip over y-axis] y = cf(x) [multiply y value by c] [if c > 1, stretch vertically] [if 0 < c < 1, shrink vertically] Example function: y = x2 Graph: y = x2+ 4 y = x2- 4 y = (x+4)2 y = (x – 4)2 y = -x2 y = (-x)2 y = ½ x2
More Transformation Practice Suppose that the x-intercepts of the graph of y = f(x) are -5 and 3 • What are the x-intercepts of the graph of y = f(x + 2) • What are the x-intercepts of the graph of y = f(x – 2) • What are the x-intercepts of the graph y = 4f(x) • What are the x-intercepts of the graph of y = f(-x)
3.6 Application: Bob wants to fence in a rectangular garden in his yard. He has 62 feet of fencing to work with and wants to use it all. If the garden is to be x feet wide, express the area of the garden as a function of x.