Download
1 / 46
460 likes | 562 Vues
Preview. What does Recombination do to Sequence Histories. Probabilities of such histories. Quantities of interest. Detecting & Reconstructing Recombinations. Haploid Reproduction Model (i.e. no recombination). 1. 1. 2. 2. 3. 3. 2N. 2N.

E N D
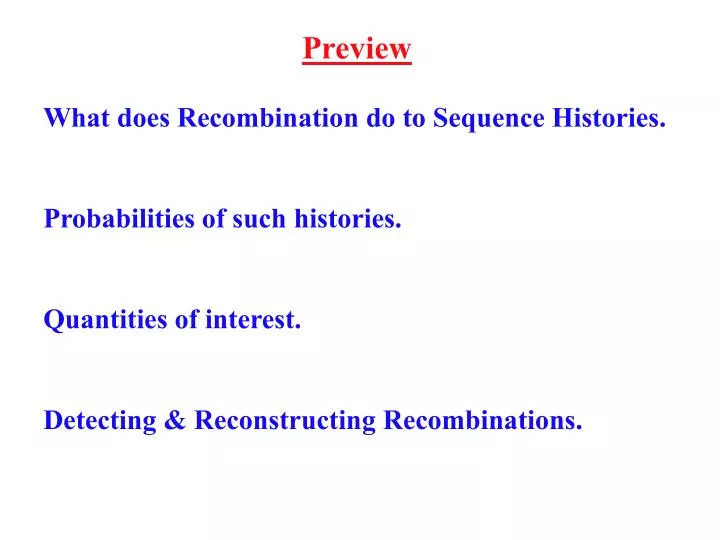
Preview What does Recombination do to Sequence Histories. Probabilities of such histories. Quantities of interest. Detecting & Reconstructing Recombinations.
Haploid Reproduction Model(i.e. no recombination) 1 1 2 2 3 3 2N 2N i. Individuals are made by sampling with replacement in the previous generation. ii. The probability that 2 alleles have same ancestor in previous generation is 1/2N. iii. The probability that k alleles have less than k-1 ancestors in previous generation is vanishing.
1 4 2 3 0 recombinations implies traditional phylogeny
Diploid Model with Recombination An individual is made by: The paternal chromosome is taken by picking random father. Making that father’s chromosomes recombine to create the individuals paternal chromosome. Similarly for maternal chromosome.
The Diploid Model Back in Time. A recombinant sequence will have have two different ancestor sequences in the grandparent.
The ancestral recombination graph Time N 1
1- recombination histories I:Branch length change 1 2 4 3 2 1 4 3 2 1 4 3
1- recombination histories II:Topology change 1 2 4 3 2 1 4 3 2 1 4 3
1- recombination histories III:Same tree 1 2 4 3 2 1 4 3 2 1 4 3
1- recombination histories IV:Coalescent time must be further back in time than recombination time. c r 1 2 4 3
Summarising new phenomena in recombination-genealogies Consequence of 1 recombination Branch length change Topology change No change Time ranking of internal nodes Multiple Ancestries Non-ancestral bridges Recombination genealogies are called ”ancestral recombination graphs - ARGs” What is the probability of different histories?
Adding Recombination r/2 r recombination pr. Nucleotide pair pr.generation. L: seq. length R= r*(L-1) Recombination pr. allele pr.generation. 2Ne - allele number r := 4N*R -- Recombination intensity in scaled process. Continuous time Continuous sequence Discrete time Discrete sequence 1/(L-1) time 1/(2Ne) time sequence sequence Recombination versus Mutation: Recombination Event: • As events, they are identically position and time wise. • Mutations creates a difference in the sequence • Recombination can create a shift in genealogy locally Waiting time exp(r/2) Position Uniform
Recombination-Coalescence Illustration Copied from Hudson 1991 Intensities Coales.Recomb. 0 1 (1+b) b 3 (2+b) 6 2 3 2 1 2
From Wiuf and Hein, 1999 Genetics Age to oldest most recent common ancestor Scaled recombination rate - r 0 kb 250 kb Age to oldest most recent common ancestor
Properties of Neighboring Trees. (partially from Hudson & Kaplan 1985) 1 2 3 1 4 2 3 4 Leaves Topo-Diff Tree-Diff 2 0.0 .666 3 0.0 .694 4 0.073 .714 5 0.134 .728 6 0.183 .740 10 0.300 .769 15 0.374 .790 500 0.670
1 2 3 k Grand Most Recent Common Ancestor: GMRCA (griffiths & marjoram, 96) i. Track all sequences including those that has lost all ancestral material. ii. The G-ARG contains the ARG. The graph is too large, but the process is simpler. Sequence number - k. Birth rate: r*k/2 Death rate: E(events until {1}) = (asymp.) exp(r) + r log(k)
1 1 1 2 2 2 3 3 Old +Alternative Coalescent Algorithm Adding alleles one-by-one to a growing genealogy Old 1
Spatial Coalescent-Recombination Algorithm (Wiuf & Hein 1999 TPB) 1. Make coalescent for position 0.0. 2. Wait Exp(Total Branch length) until recombination point, p. 3. Pick recombination point (*) uniformly on tree branches. 4. Let new sequence coalesce into genealogical structure. Continue 1-4 until p > L.
Properties of the spatial process i. The process is non-Markovian * = * ii. The trees cannot be reduced to Topologies
1 3 2 4 Compatibility 1 2 3 4 5 6 7 1 A T G T G T C 2 A T G T G A T 3 C T T C G A C 4 A T T C G T A i i i i. 3 & 4 can be placed on same tree without extra cost. ii. 3 & 6 cannot. Definition: Two columns are incompatible, if they are more expensive jointly, than separately on the cheapest tree. Compatibility can be determined without reference to a specific tree!!
Hudson& Kaplan’s RM (k positions can at most have (k+1) types without recombination) ex. Data set: A underestimate for the number of recombination events: ------------------- --------------- ------- --------- ------- ----- If you equate RM with expected number of recombinations, this would be an analogue to Watterson’s estimators. Unfortunately, RM is a gross underestimate of the real number of recombinations.
Myers-Griffiths’ RM S Basic Idea: 1 Define R: Rj,k is optimal solution to restricted interval., then: Rj,i Bj,i k j i Rj,k
Recombination Parsimony Data 1 2 3 Trees T 1 2 i-1 i L Recursion:W(T,i)= minT’{W(T’,i-1) + subst(T,i) + drec(T,T’)} Initialisation:W(T,1)= subst(T,1) W(T,i) - cost of history of first i columns if local tree at i is T subst(T,i) - substitution cost of column i using tree T. drec(T,T’) - recombination distance between T & T’
Metrics on Trees based on subtree transfers. Trees including branch lengths Unrooted tree topologies Rooted tree topologies Tree topologies with age ordered internal nodes Pretending the easy problem is the real problem, causes violation of the triangle inequality:
Observe that the size of the unit-neighbourhood of a tree does not grow nearly as fast as the number of trees. Explicit computation No known formula Allen & Steel (2001) Song (2003)
The 1983 Kreitman Data (M. Kreitman 1983 Nature from Hartl & Clark 1999)
11 sequences of alcohol dehydrogenase gene in Drosophila melangaster. • Can be reduced to 9 sequences (3 of 11 are identical). • 3200 bp long, 43 segregating sites. We have checked that it is possible to construct an ancestral recombination graph using only 7 recombination events.
5 6
Quality of the estimated local tree (1,2) - (3,4,5) (1,2,3) - (4,5) True ARG 1 2 3 4 5 Reconstructed ARG 1 3 2 4 5 (1,3) - (2,4,5) (1,2,3) - (4,5) n=7 Rho=10 Theta=75 Due to Yun Song
Actual, potentially detectable and detected recombinations Leaves Topo-Diff Tree-Diff 2 0.0 .666 3 0.0 .694 4 0.073 .714 5 0.134 .728 6 0.183 .740 10 0.300 .769 15 0.374 .790 500 0.670 1 2 3 1 4 2 3 4 n=8 q=40 Minimal ARG q=15 True ARG Due to Yun Song 400 kb 0
Ancestral states s1 = s2 = s3 = s4 = s5 = 0 0 0 0 0 0 1 1 0 1 0 1 1 1 0 0 1 1 1 1 3 2 1 1 2 3 0000 0011 0101 1100 1111 0000 00xx xx11 0101 1100 1111 0000 00xx 0101 1100 1111 Yun Song
2nd 1st k1 (k2+1)*k1 +1 possible ancestral columns. k2 Ancestral configurations to 2 sequences with 2 segregating sites:
Enumeration of Ancestral States(via countingrestricted non-negative integer matrices with given row and column sums) • Asymptotic growth? • Enumerating ancestral states in minimal histories? • Branch and bound method for computing the likelihood? Due to Yun Song
1 2 3 4 1 2 4 3 Ignoring recombination in phylogenetic analysis General Practice in Analysis of Viral Evolution!!! Recombination Assuming No Recombination Mimics decelerations/accelerations of evolutionary rates. No & Infinite recombination implies molecular clock.
Gene Conversion Recombination: Gene Conversion: Compatibilities among triples: - - +
Gene Conversions & Treeness Pairwise Distances as sequences gets longer and longer Recombination Gene Conversion Star tree: Coalescent:
Summary What does Recombination do to Sequence Histories. Probabilities of such histories. Quantities of interest. Detecting & Reconstructing Recombinations.