Download
1 / 38
390 likes | 576 Vues
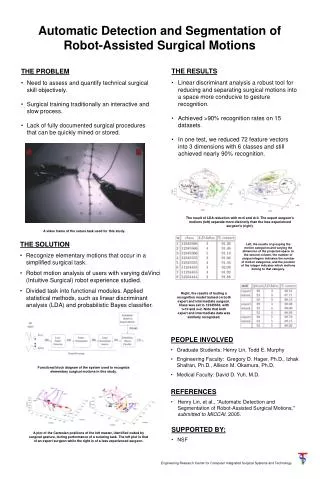
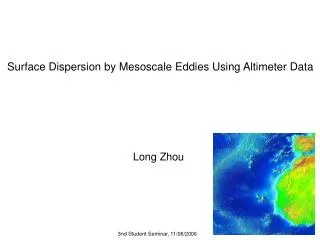
Automatic Detection, Segmentation and Visualization of Mesoscale Eddies in MICOM. Bin J. John CIS Dept, UMass Dartmouth. Outline of talk. Mesoscale Eddies MICOM Dataset Detection of Eddies Segmentation of Eddies Visualization of extracted eddies Conclusion & Future Work. Mesoscale Eddies.

E N D
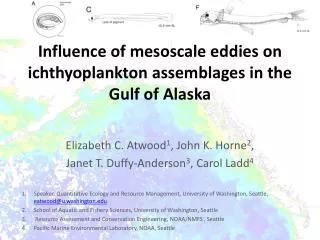
Automatic Detection, Segmentation and Visualization of Mesoscale Eddies in MICOM Bin J. John CIS Dept, UMass Dartmouth
Outline of talk • Mesoscale Eddies • MICOM Dataset • Detection of Eddies • Segmentation of Eddies • Visualization of extracted eddies • Conclusion & Future Work
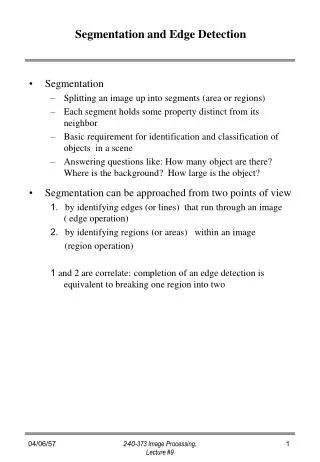
Mesoscale Eddies • What are mesoscale Eddies? • Why are they important? • Why an automatic detection of eddies?
What are mesoscale eddies • Mesoscale: Size scale of about 100km • Eddies are energetic swirling currents found all over the ocean • Mesoscale eddies have deep roots of about 5km • They can transport momentum to the sea floor
Why are mesoscale eddies important? • Poleward Heat transport • Heat moved by the from the equator towards poles • An important quantity in Climate Studies • Oceans are partly responsible for poleward heat transport • Contribution of mesoscale eddies to heat transport
Why are mesoscale eddies important? • Biological communities of the ocean • Strongly affected by ocean circulation and mesoscale eddies • Nutrient rich cold water at the bottom • Cold cyclonic eddies can lift this nutrient waters towards surface • Sunlight on surface helps nutrient rich water promote chlorophyll rich plankton, and thereby the food chain from plankton to whales
Why an automatic detection of eddies? • A large number of eddies present in the ocean • Computation of contribution of mesoscale eddies to poleward heat transport • Enable motion tracking of eddies to study it’s trajectory • Visualize the different kinds of eddies present all over the ocean
MICOM Dataset • Miami Isopycnic Coordinate Ocean Model • Available Parameters • Size of this Dataset • Data Profile
Miami Isopycnic Coordinate Ocean Model • Is the dataset used in this project • Is a numeric 3D model of the ocean where vertical coordinate is density • Is where the ocean is divided into 11 layers, each of which maintains its own density -- hence the term isopycnic, meaning constant density
Available parameters • MICOM provides Temperature, Velocity, Salinity information of the ocean • Information available in a spatial resolution of 1/12th degree • Temporal resolution of every 3 days, for a whole year • Entire Atlantic ocean in the northern hemisphere considered
Size of this dataset • Snapshots of the ocean, is available for 120 different days at 11 different layers • That’s over a billion points in the ocean for which Temperature, Velocity, Salinity information is available • Today we have massive datasets of information, powerful computers, and advanced computing techniques • Utilizing these fully can unravel insights about the world in a way not possible before
Data Profile • Histograms give a graphical overview of data distribution, by plotting the number of occurences of a range of value • With multiple histograms presented here, a quick overview of the distribution for different layers of the oceans at different times can be visualized
Detection of Eddies • Visualizing Eddies • Pattern recognition • Structuring Element for Finding Eddies • Results
Visualizing eddies • What you see is what you could possibly detect • Need to see the feature prominently • Need a view where a pattern is perceived before an automatic detection can be done based on this pattern
Results Data Number of eddies examined False Positives Accuracy Visualization Used Day 27 Layer 4 40 0 100% Quiver Plots Day 12 Layer 8 39 1 97.50% Quiver Plots Day 15 Layer 8 18 1 94.44% Quiver Plots Day 24 Layer 4 1059 187 82.44% Cone Plots, Streamline Day 33 Layer 8 575 77 86.66% Streamline
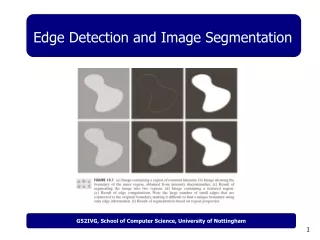
Segmentation of Eddies • Donut Structuring Element • Statistical Border Detection • Segmented Eddies • Circle vs Ellipse Method • Results
Donut Structuring element • Three consecutive circles • More number of sample points than a single circle/ellipse alone • Donut of radius 11 would sample 240 points
Statistical Border Detection
Results • Number of eddies verified manually: 120 • Number of eddies that were mis-segmented by an area > 15% = 20 • Accuracy of segmentation technique: 83.3%
Visualizations of eddies • Enhanced Pseudocolor plots • Movies of eddies in motion • Multi-Layer Streamline plots • 3D Cone plots
Conclusions and Future Work • Fairly Accurate Pattern Recognition • Able to estimate poleward heat transport of eddies from the results of this project • Build eddy tracking algorithm • Develop pattern recognition algorithm for temperature only databases • Geometrically Deformable Model can be used for more accurate segmentation