Download
1 / 15

E N D
1. 6-2: The Standard Normal Distribution Math 10
2. Review Continuous Random Variable:
A variable x determined by probability that can take on an infinite range of values with no gaps in the range.
Ex: Tire pressure
3. Distributions for Continuous Random Variables A graph that represents the possible values for the random variable and the probabilities associated with them.
4. Probability Density Curve The graph of a continuous probability distribution is called a density curve.
All density curves must obey the following properties:
The total area under the curve must equal 1.
Every point on the curve must have a vertical height that is 0 or greater (0=p(x)=1).
Because the total area under the density curve is equal to 1, the areas correspond to probabilities.
5. Uniform Distribution A continuous random variable has a uniform distribution if the values of the variable spread evenly over its range of possibilities.
All values have the same probability
6. Examples: Using the yellow uniform distribution. Find the probability a value less than -0.5 is chosen.
Using the green uniform distribution. Find the probability that a value between 1.8 and 2.4 is chosen.
7. Where does the Standard Normal come from?
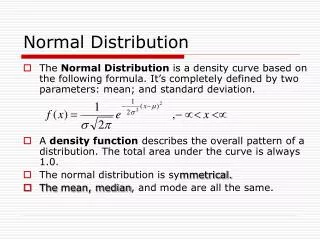
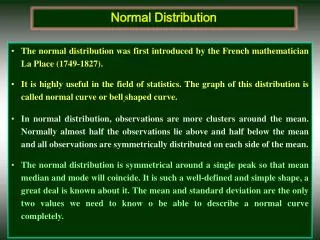
8. Any curve that is Bell-Shaped is a Normal Distribution
9. Normal Distribution
10. The Standard Normal Distribution
11. Z-Score Each data value can be converted to a z-score using the formula for standardization:
Each data value can be location on the x axis of the density curve.
12. Finding Probabilities Using Z-Scores Table A-2 on pages 772 and 773
Negative z Scores table represents P(z<a) for negative z values
Positive z Scores table represents P(z<a) for positive z values
Z column represents the z-scores to one decimal place.
The top row represents the second decimal place of the z-score.
These two meet at the probability for P(z<a).
13. Meaning of Probabilities P(z>a): the probability that a z score is greater than the z score a. (to the right of a)
P(z<a): the probability that a z score is less than the z score a. (to the left of a)
P(a<z<b): the probability that a z score is between the z scores of a and b. (between a and b)
14. Examples: Use the chart to find the following probabilities P(z<-2.13)
P(z<0.56)
P(z>-0.46)
P(z>1.77)
P(-2.24<z<0.98)
P(0.29<z<2.65)
15. Example: Using a probability to find a z-score Suppose the accuracy of readings on thermometers are normally distributed is mean o� and standard deviation of 1�. If 1% of the thermometers are rejected because they have readings that are too high and another 1% are rejected because they have readings that are too low, find the two cutoff values for readings that would be rejected.