Download
1 / 34
340 likes | 455 Vues
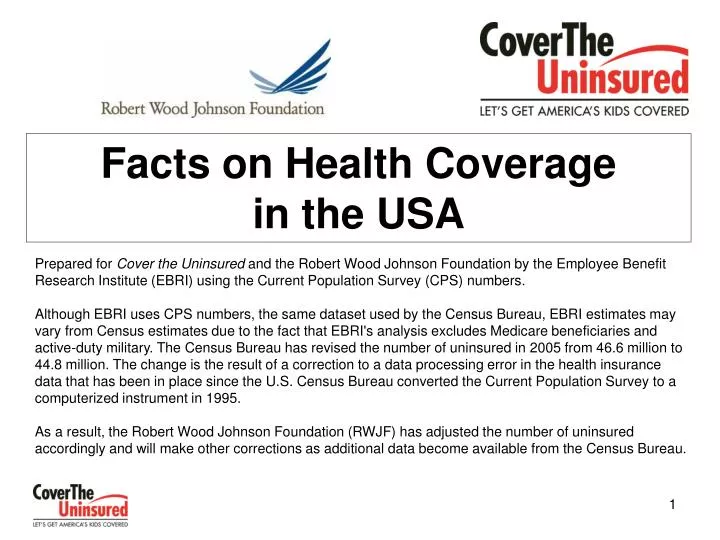
Facts on Health Coverage in the USA. Prepared for Cover the Uninsured and the Robert Wood Johnson Foundation by the Employee Benefit Research Institute (EBRI) using the Current Population Survey (CPS) numbers.

E N D
Facts on Health Coverage in the USA Prepared for Cover the Uninsured and the Robert Wood Johnson Foundation by the Employee Benefit Research Institute (EBRI) using the Current Population Survey (CPS) numbers. Although EBRI uses CPS numbers, the same dataset used by the Census Bureau, EBRI estimates may vary from Census estimates due to the fact that EBRI's analysis excludes Medicare beneficiaries and active-duty military. The Census Bureau has revised the number of uninsured in 2005 from 46.6 million to 44.8 million. The change is the result of a correction to a data processing error in the health insurance data that has been in place since the U.S. Census Bureau converted the Current Population Survey to a computerized instrument in 1995.As a result, the Robert Wood Johnson Foundation (RWJF) has adjusted the number of uninsured accordingly and will make other corrections as additional data become available from the Census Bureau.
Overview 3 Uninsured by Age 4-5 Uninsured Children 6-9 Uninsured by Race/Ethnicity 10 Educational Attainment 11-12 Income and Poverty Status 13 Uninsured Workers 14-15 Source of Coverage 16 Employment-Based Coverage 17-19 Industry and Occupation 20-21 Retiree Health Benefits 22 Health Behavior 23 National Spending on Healthcare 24-28 Health Insurance Premiums 29-31 Out-of-Pocket Spending on Health Care Services 32-34 Table of Contents:Facts on Health Coverage in the USA
Overview The problem of the uninsured is continuing to grow. The federal government estimates that nearly 45 million individuals lacked health insurance coverage of any kind during 2005. Other research shows that tens of millions more Americans go without health coverage for shorter periods of time. Percentage of Non-elderly Adult Workers Without Health Insurance, 1987-2005 Source: Employee Benefit Research Institute estimates from the Current Population Survey, March 1988-2006 Supplements.
As most elderly people are covered by Medicare, nearly all the uninsured are under age 65. Children are more likely to have coverage than non-elderly adults, which reflects their much higher rates of public coverage through Medicaid and SCHIP. Uninsured by Age Percentage Uninsured Among Non-elderly Adults by Age, 2005 Source: Employee Benefit Research Institute estimates from the March Current Population Survey, 2006 Supplement
Uninsured by Age Uninsured Non-elderly Adult Population by Age, 2005 Source: Employee Benefit Research Institute estimates from the March Current Population Survey, 2006 Supplement.
Uninsured Children Nearly twenty percent of uninsured Americans – 8.1 million individuals – are children. While children are more likely to be insured than non-elderly adults, health insurance is particularly important for children. Uninsured children are more likely than insured children to lack a usual source of health care, to go without needed care and to experience worse health outcomes. Uninsured Children by Race and Ethnic Origin, 2005 Source: Employee Benefit Research Institute estimates from the March Current Population Survey, 2006 Supplement
Uninsured Children Uninsured Children by Age, 2005 Source: Employee Benefit Research Institute estimates from the March Current Population Survey, 2006 Supplement.
Uninsured Children Uninsured Children by Family Poverty Status, 2005 Source: Employee Benefit Research Institute estimates from the March Current Population Survey, 2006 Supplement.
Uninsured Children Uninsured Children by Work Status of the Family Head, 2005 Source: Employee Benefit Research Institute estimates from the March Current Population Survey, 2006 Supplement.
Uninsured by Race/Ethnicity Relative to their numbers in the overall population, members of racial and ethnic minority groups make up a disproportionate share of the uninsured population. A variety of economic and social factors underlie these disparities. Percentage Uninsured Among the Non-elderly Population by Race and Ethnic Origin, 2005 Source: Employee Benefit Research Institute estimates from the March Current Population Survey, 2006 Supplement
Educational Attainment The likelihood of being insured increases as level of educational attainment rises. However, fully 40 percent of the difference in insured rates between those with no high-school diploma and those with some post-college education would disappear if the two groups were alike with respect to demographic, geographic and health status factors. Percentage Uninsured Among Non-elderly Adults by Education, 2005 Source: Employee Benefit Research Institute estimates from the March Current Population Survey, 2006 Supplement
Educational Attainment Uninsured Non-elderly Adults by Education, 2005 Source: Employee Benefit Research Institute estimates from the March Current Population Survey, 2006 Supplement.
National surveys consistently show that the high cost of health insurance is the primary reason people are uninsured. Income and Poverty Status Uninsured Non-elderly Population by Family Poverty Status, 2005 Source: Employee Benefit Research Institute estimates from the March Current Population Survey, 2006 Supplement.
Having a job, even a full-time job, does not guarantee access to health insurance. Uninsured Workers Uninsured Non-elderly Population by Work Status of Family Head, 2005 Source: Employee Benefit Research Institute estimates from the March Current PopulationSurvey, 2006 Supplement
Uninsured Workers Non-elderly Adult Uninsured Workers by Work Status, 2005 Source: Employee Benefit Research Institute estimates from the March Current Population Survey, 2006 Supplement.
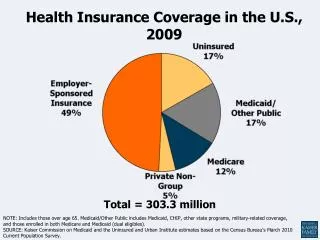
Employment-based health insurance continues to be the predominant source of coverage for the non-elderly population. Source of Coverage Health Insurance Coverage of Non-elderly Americans, by Source of Coverage, 2005 Source: Employee Benefit Research Institute estimates from the March Current Population Survey, 2006 Supplement.
Employment-Based Coverage Average annual increases in health insurance premiums for all firms escalated from 0.8 percent in 1996 to 13.9 percent in 2003, but then declined to 7.8 percent in 2006. Over approximately the same period, the percentage of workers without health insurance increased from 15.5 percent in 1996 to 18.1 percent in 2005, with workers accounting for 26.3 million of the 44.4 million uninsured. Percentage of Non-elderly Adult Workers Without Health Insurance, 1987-2005 . Source: Employee Benefit Research Institute estimates from the Current Population Survey, March 1988-2006 Supplements.
Employment-Based Coverage Non-elderly Adult Uninsured Workers by Firm Size, 2005 Source: Employee Benefit Research Institute estimates from the March Current Population Survey, 2006 Supplement.
Employment-Based Coverage Percentage of Employers Offering Health Benefits by Firm Size, 1996-2006 Source: Kaiser/HRET Survey of Employer-Sponsored Health Benefits.
Over one-third (36.2 percent) of workers employed in agriculture, forestry, fishing, mining and construction are uninsured, compared to 21.2 percent in personal services, 17.8 percent in wholesale and retail trade, 14.1 percent in manufacturing and 6.0 percent in the public sector. Workers in wholesale and retail trade and personal services account for 61.9 percent of all uninsured workers. Industry and Occupation Non-elderly Adult Uninsured Workers by Industry, 2005 Source:Employee Benefit Research Institute estimates from the March Current Population Survey, 2006 Supplement.
Industry and Occupation Non-elderly Adult Uninsured Workers by Occupation, 2005 Source:Employee Benefit Research Institute estimates from the March Current Population Survey, 2006 Supplement.
Just as employers are not legally required to offer health insurance to their employees, the provision of retiree health benefits generally is a voluntary arrangement to which employers are not bound. Since the mid-1990s, large employers (500+ employees) have cut back steadily on retiree benefits. Retiree Health Benefits Provision of Retiree Health Benefits by Employers with 500+ Employees, 1993-2006 Source: Mercer Human Resources Consulting, 2006. (Data for 2002 are not comparable to other years.)
Health insurance coverage is an important predictor of whether individuals obtain health-promoting and life-extending health screenings. Health Behavior Time Since Last Pap Smear, Female Adult Workers by Insurance Status, 2004 Source: Employee Benefit Research Institute estimates from the 2004 Medical Expenditure Panel Survey.
Health care spending in the United States has grown rapidly since the 1960s, at an average rate of 10 percent a year. National Spending on Health Care National Health Expenditures (NHE), Aggregate and Share of Gross Domestic Product (GDP), 1960-2016 Source: Employee Benefit Research Institute estimates from Centers for Medicare and Medicaid Services and U.S. Department of Commerce. (2006-2016 data are projected.)
While health care spending has been increasing, the distribution of health care spending among different services has been changing. National Spending on Health Care Distribution of National Health Expenditures, by Type of Expenditure, 1960-2016 Source: Employee Benefit Research Institute estimates from Centers for Medicare and Medicaid Services.
The share of private health care spending that health insurance covers has more than doubled since the 1960s. National Spending on Health Care Out-of-Pocket Spending as a Percent of Total Private Spending, 1960-2016 Source: Employee Benefit Research Institute estimates from Centers for Medicare and Medicaid Services.
The cost of providing health care services has been increasing faster than the Gross Domestic Product (GDP) since 1998, but the gap between the two declined recently as the economy recovered from recession and health care costs grew more slowly. National Spending on Health Care Annual Growth Rates for Spending on Health Care Services and Gross Domestic Product (GDP), 1998-2006 Source: Bradley C. Strunk, Paul B. Ginsburg, and John P. Cookson. "Tracking Health Care Costs: Declining Growth Trend Pauses In 2004." Health Affairs Web Exclusive, June 21, 2005; and Ginsburg, Paul B., Bradley C. Strunk, Michelle I. Banker, and John P. Cookson. "Tracking Health Care Costs: Continued Stability But At High Rates In 2005.." Health Affairs Web Exclusive, Oct. 3, 2006.
Recent spending on health care services has slowed for all categories of health care, but cost increases for hospital outpatient services and prescription drugs continue to outpace those for inpatient and physician services. National Spending on Health Care Annual Per Capita Percentage Change in Health Care Spending, by Category of Service, 2001-2006 Source: Bradley C. Strunk, Paul B. Ginsburg, and John P. Cookson. "Tracking Health Care Costs: Declining Growth Trend Pauses In 2004." Health Affairs Web Exclusive, June 21, 2005; and Ginsburg, Paul B., Bradley C. Strunk, Michelle I. Banker, and John P. Cookson. "Tracking Health Care Costs: Continued Stability But At High Rates In 2005.." Health Affairs Web Exclusive, Oct. 3, 2006.
With a few exceptions, growth in health insurance premiums has been outpacing overall inflation and increases in workers earnings since the late 1980s. Health Insurance Premiums Annual Growth Rates for Health Insurance Premiums, Workers Earnings, and Overall Inflation, 1988-2006 Source: Kaiser Family Foundation/Health Research and Educational Trust.
Workers have been paying more per year for health benefits in the workplace, but they continue to pay the same share of total premiums. Health Insurance Premiums Average Monthly Worker Premium Contribution, 1988-2006 Source: Kaiser Family Foundation/Health Research and Educational Trust.
Workers have been paying more per year for health benefits in the workplace, but they continue to pay the same share of total premiums. Health Insurance Premiums Percentage of Premium Paid by Covered Workers, 1988-2006 Source: Kaiser Family Foundation/Health Research and Educational Trust.
Out-of-Pocket Spending on Health Care Services Distribution of Deductibles for Employee-Only PPO Coverage, 2000-2006 Source: Kaiser Family Foundation/Health Research and Educational Trust.
Many workers are paying higher co-payments for physician visits in HMOs. Out-of-Pocket Spending on Health Care Services Percentage of Covered Workers Facing Various HMO Co-payment Amounts for Physician Office Visits, 1996-2006 Source: Kaiser Family Foundation/Health Research and Educational Trust.
Co-payment levels for prescription drugs have increased, and employers have added a fourth tier to the common three-tier co-payment system. Out-of-Pocket Spending on Health Care Services Average Co-payments Per Prescription in Multi-Tier Arrangements, 2000-2006 Source: Kaiser Family Foundation/Health Research and Educational Trust.