Download
1 / 87
880 likes | 1.12k Vues
Summer Internship Program Annual Symposium 2012. Agenda. Welcome Background Overall Purpose of Symposium Symposium Format Closing Remarks Meet and Greet the Interns UM Football Stadium Tour. Acknowledgements. Sponsors: Health and Retirement Study Life Course Development Program (2)

E N D
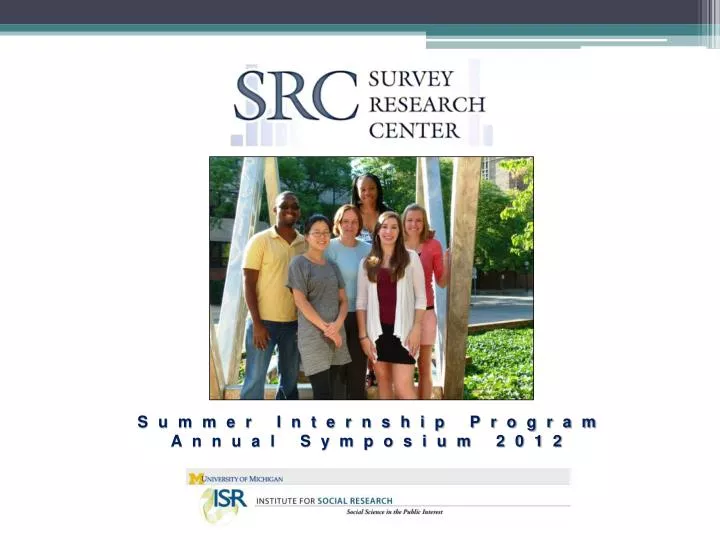
Summer Internship Program Annual Symposium 2012
Agenda • Welcome • Background • Overall Purpose of Symposium • Symposium Format • Closing Remarks • Meet and Greet the Interns • UM Football Stadium Tour
Acknowledgements • Sponsors: • Health and Retirement Study • Life Course Development Program (2) • Survey Methodology Program • Social Environment and Health Program (2) • Partners: • Senior Staff Advisory Committee • SRC Administrators & SRC Diversity Committee • Summer Institute in Survey Research Techniques • Survey Research Operations • Inter-university Consortium for Political and Social Research • ISR and SRC Human Resources • SRC Computing • ISR and SRC Director’s Offices • ISR Director’s Diversity Advisory Committee
The Effects of Incarceration and Probation on Reoffending and Employment Nicole Yadon Social Environment & Health Sponsor: Dr. Jeffrey Morenoff
Issues in Studying the Effects of Mass Incarceration • Framing the research question and identifying comparison groups • Some studies use survey samples to compare people who have vs. have not been to prison • We frame the question as being about alternative ways of sanctioning convicted felons • Our comparison groups are restricted to the population of people convicted of felonies • We compare people who were sentenced to prison, jail, probation, etc. • Obtaining appropriate data • Survey samples usually don’t include institutionalized populations • Establishing causality • True experiments are not possible – judges will not randomly allocate sentences • Problem of unobserved confounders • Judges may base their decisions on factors that are not observed by researchers (e.g., temperament) • These same factors may predict future outcomes (e.g., recidivism, employment)
Our Study • Question:What is the effect of being sentenced to prison vs. probation on future criminal offending and employment? • Data and sample: Administrative records on all felony convictions in Michigan from 2003-06 • Records from courts, department of corrections, police, unemployment insurance agency • Method: Quasi-experimental designs • Using random assignment of judges to cases as “instrumental variable” • Exploiting “discontinuities” in sentencing guidelines • Guidelines restrict judges’ sentencing options based on (a) offense severity and (b) prior criminal record
My Role: Circuit Court Demographic Information • Background research on operation of Michigan Circuit Court system • Reading court documents • Talking to judges and court officials • Collecting data on judges (part of new project sentencing disparities) • Collecting data on judges from circuit court websites and “Judgepedia” • Obtaining records from Michigan Supreme Court Administrative Office • Biographical data on judges • Circuit-level data on court processing
From 2003-2009 there were 289 judges in office • 60% (n=173) were elected • 40% (n=116) were appointed
Acknowledgements • Jeffrey Morenoff, Ph.D. • David Harding, Ph.D. • MDOC & SCAO • SRC Summer Internship Program
Urban Social and Built Environment and the Trajectories of Social Isolation: Findings from Detroit MI CHOICE Population Min Hee Kim (kminhee@umich.edu) Social Environment and Health Program Sponsor: Philippa Clarke, Ph.D.
Internship Goals • Analytic skills for multi-level data structure • Explore the mechanisms through which neighborhood affects older adults’ health • Engage in social environment and health scholarships • Work and family balance
Background • Why is social isolation important at later life? • Staying at home, instead of admission to nursing home, has benefits at both individual and societal level • Understanding social and built environment factors that affect social isolation is critical
Detroit older adults experienced rapid socioeconomic • and structural decline in last decades
Research Question & the Focus • How do neighborhood social and built environments explain the trajectories of social isolation, adjusting for socio-demographic and health factors? • Focus on those who have unmet needs (i.e., Medicaid Waiver Program Recipients) in Central Detroit
Conceptual Model Social Isolation Initial Status Social Isolation Overtime
Methodology • Analytic Methods Generalized Hierarchical Linear Modeling (HLM) • Data 1) Michigan Minimum Data Set (MDS) for Home Care (2000-2008) followed every 90 days 2) Neighborhood Data using Systemic Social Observation (SSO) methods
SSO Data • Neighborhood audit of all 4 streets in each client’s residential block • Using Google Street View (2007-2009) • Indicators of built physical and social environment can be reliably assessed with a virtual audit instrument (Clarke, et al. (2010) Health and Place)
Social Isolation • Social Isolation was measured as a dichotomous variable indicating whether client’s level of participation in social, religious, occupational or other preferred activities declined • As compared to the previous 180 days, as assessed by the case manager
Constructed Variables • Difficulties with Activities of Daily Living (ADL) • 7 items: Transfer, Walking, Dressing, Eating, Toilet, Grooming Bathing • Individual item measured : 0 (independent) ~ 5 (activity did not occur) • Difficulties with Instrumental Activities of Daily Living (IADL) • 7 items: Meal, Housework, Money, Medications, Phone, Shop, Travel) • Individual item measured: 0 (no difficulty) ~ 2 (great difficulties) • Social Disorder Index (9 items) 1) Graffiti painted over; 2) Garbage, litter or broken glass; 3) Cigarette or cigar butts; 4) Empty beer or liquor bottles in streets, 5) Gang graffiti; 6) Other graffiti on buildings; 7) Abandoned car; 8) Condoms; 9) Drug related paraphernalia on the side walk
Individual Characteristics at Baseline (2000-2008) (N=1,009) (weighted)
Neighborhood Characteristics at Baseline (2000-2008) (N=1,009) (weighted) • Average % of poor street on the block 0.23 (s.d. 0.27) • Average social disorder index 1.44 (s.d. 1.25 ) • Average % of residential security sign in the block 0.02 (s.d. 0.78)
Longitudinal Characteristics (2000-2008) (N=4,875) • Average number of observation per person= 5.1 • Weight generated based on the probability of retention • Individual data was truncated at 3 years • Average observations per neighborhood cluster 2.1
Discussions • Practical implications • Generalization to urban older adults population in poverty • Some limitations to be further examined • Methodological Implications • Policy Implications
Thank youSpecial thanks to.. Philippa Clarke Ph.D., George Myers Ph.D., and 2012 Summer SRC Interns*Funding for the geocoding/SSO part of this project was provided through Grant number K01EH000286-01 (Clarke) from the Centers for Disease Control and Prevention (CDC)
Disclosure and Quality of Answers in Text and Voice Interviews on iPhones Monique Kelly Survey Methodology Program Sponsor: Fred Conrad, Ph.D.
Parent Study • Examined • Data quality (satisficing, disclosure, straightlining) • Completion rates • Respondent satisfaction • Four existing or plausible survey modes that work through native apps on the iPhone
Items • First, safe-to-talk question • 32 Qs taken from major US social surveys and methodological studies • E.g ., Pew Internet & American Life Project • Types of QS • Yes/No • Numerical • Categorical • Battery Items (series of Qs with same response options)
Respondents • n = 642 iPhone users (age > 21) • 158 to 165 randomly assigned to each mode • Recruited from: • Craigslist • Facebook • Google Ads • Amazon Mechanical Turk • Incentive • $20 iTunes gift code
Summary • Voice vs. Text • Text produced higher data quality • Greater disclosure, less satisficing, high satisfaction • Human vs. Automated • Automated interviews on a smartphone (in these modes) can lead to data at least as high in quality as data from human interviews in same modes • No more satisficing than with human interviewers! • More disclosure
Goals of Project • To see how the interaction between R and the I agent differ across modes. • How this explain differences in answers to same questions across modes. • To understand interaction around disclosure of personal/sensitive information.
Example Research Questions • Does more departure from the script reduce disclosure? • automated interviewers never depart from script • Do respondents exhibit less human-like communication (e.g. disfluencies) when interacting with automated speech system?
Rendering Then converted into an avi file PAMSS interface Opened in Camtasia
Coding Coding was done in a tool called Sequence Viewer.
Coding (continued) • Respondent Codes • Examples • Answer question • Partial answer • Interviewer Codes • Examples • Ask question exactly as worded • Ask question with wording change • Questions Raised • Possible Additions?
Future Analyses • Relationship between sciptedness and disclosure. • Whether I asks the question exactly as worded or not • Comparison of R’s speech when I is human or automated.
Conclusion • Aim • Interviewing agent effect on respondent’s answers. • Project in early phases • Three other modes to be transcribed, coded, and analyzed. • Stay tuned for more!
Acknowledgements • George Myers, Ph.D. • Fred Conrad, Ph.D. • Michael Schober • Andrew Hupp • Lloyd Hemingway • Chan Zhang • Mingnan Liu • Chris Antoun • The staff of Survey Methodology Program • CMT
Understanding the Achievement Gap: Do Parent Expectations and School Climate Matter? Adrian Gale, MSW University of Michigan Joint Program in Social Work and Developmental Psychology Sponsor: Toni Antonucci Ph.D. Life Course Development