Download
1 / 32
320 likes | 501 Vues
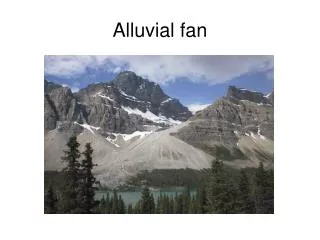
Alluvial Fan Flood Hazard Mapping and Dam Failure Analysis using USGS Diffusion Hydrodynamic Model. by Neil M. Jordan, P.E. September 11, 2003. USGS DIFFUSION HYDRODYNAMIC MODEL. USGS DHM 21

E N D
Alluvial Fan Flood Hazard Mapping and Dam Failure Analysis using USGS Diffusion Hydrodynamic Model by Neil M. Jordan, P.E. September 11, 2003
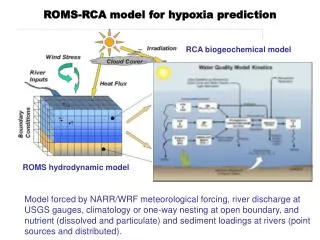
USGS DIFFUSION HYDRODYNAMIC MODEL USGS DHM 21 Developed by Drs. T.V. Hromadka and C.C. Yen for dam break analysis of Long Valley Dam (Crowley Lake) above Bishop, CA.
Diffusion Hydrodynamic Model • Dam break flow passing over alluvial fan involves two-dimensional unsteady nonuniform unconfined overland flow, cross-boundary flow, backwater effects, and floodplain-channel interaction. • DHM provides all the tools for analysis.
Unconfined • Flow bounded by topography or intentional critical depth, or intentional rating curve. • Flow not bounded by prescriptive limits of cross sections or arbitrary boundaries. • No unintentional Moses Effects.
The Moses Effect Boundary elements should be dry. If not, extend model to topographic boundary.
DHM Governing Equations • Saint-Venant equations: • Continuity – conservation of mass. • Conservation of momentum, with friction slope approximated from Manning’s equation. • Two sets of equations, one for the x-direction, one for the y-direction.
S-V Momentum Terms Local + Convective + Pressure + Gravity + Friction = 0 • Gravity + Friction terms = Kinematic Wave • Pressure + Gravity + Friction terms = Diffusion Wave (DHM) • All terms = Dynamic Wave ….but acceleration (inertia) terms sum to nearly zero for Froude numbers less than ~ 4.
USGS DHM Testing • Courant condition – time step variables. • Supercritical flow. • Grid element orientation.
Courant Condition "Δt ≤ Δx/(V+ c): It's not just a good idea. It's the law." Courant, after Einstein, after USGS FEQ
DHM Time Step Sensitivity Initial Estimate Final Model DTMIN = 3 sec 2 sec DTMAX = 72 sec 20 sec DTOL = 0.4 ft 2 ft DTOLP = 16 % 25 % Dp* = 7.420 ft 7.903 ft * Maximum depth for grid element #2058
Supercritical Flow Test • Critical depth control @ 0 ft • Mild slope 0 ft – 500 ft • Hydraulic jump @ ~470-500 ft • Grade break @ 500 ft • Steep slope 500 ft – 800 ft • Grade break@ 800 ft • Mild slope 800+ ft
Grid Element Orientation Test • Exact solution to flow equations if grid elements aligned with flow direction. • Maximum error if grid elements aligned 45 degrees to flow direction.
USGS DHM Model Development • Digital terrain data – USGS Digital Elevation Models. • Import and join DEMs with surface modeling program. • Apply DHM grid to surface model. • Extract DHM grid center coordinates – use surface modeling program to calculate elevations and write geometry output file. • Import geometry into DHM data file.
Develop & Apply DHM Grid • “Grid Development System” (GDS) developed by Venezuelan Central University for FLO-2D. • Use GDS only to calculate grid element center coordinates and boundary elements, but not elevations. • GDS output file is identical to DHM input file, but with elevations calculated by surface modeling program.
USGS DHM Model Refinement • Inspect model for unintended “dams” on flat surfaces or thalwegs caused by diagonal pairs of grid elements being higher than opposing diagonals. • Add open channel elements. • Check for The Moses Effect.
DHM Model Characteristics Area Area ~Length (sq mi) (ac) (mi) Upper (dam) basin: 1.24 794 1.7 Total area: 24 15,500 14
USGS DHM Model Calibration • Calculate dam tributary area rainfall-runoff using HEC-HMS and DHM. • Adjust DHM global roughness (basin N) to match DHM to HEC-HMS peak discharge. • Calculate summation hydrographs (s-graphs).
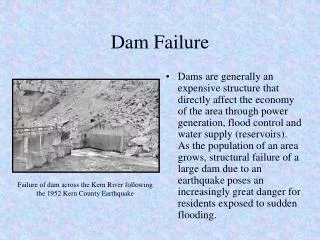
Dam Failure Analysis • Define dam breach hydrograph for ~40 ft high, ~150 ac-ft earth dam. • Compare DHM performance with NWS Simplified Dam Break model for 1-D part (Qp = 32,695 cfs). • Calculate dam breach hydrograph with NWS BREACH model (Qp = 34,826 cfs). • Add 10-year, 6-hour rainfall hydrograph. • Calculate flood, peak, and deflood times.
DHM Output File MODEL TIME(HOURS) = 3.70 (SECONDS) = 0.133E+05 (TOTAL TIMESTEP NUMBER) = 1.3E+03 EFFECTIVE RAINFALL(IN/HR) = 0.13 ***FLOOD PLAIN RESULTS*** INFLOW RATE AT NODE 2058 IS EQUAL TO 0.00 NODE 1 2 3 4 5 6 7 8 9 10 DEPTH 0.028 0.053 0.031 0.123 0.019 0.054 0.028 0.060 0.025 0.085 ELEVATION 1679.718 1679.163 1678.961 1678.423 1680.199 1676.674 1680.018 1680.520 1681.185 1678.495 NODE 11 12 13 14 15 16 17 18 19 20 DEPTH 0.057 0.021 0.050 0.027 0.041 0.105 0.069 0.031 0.076 0.051 ELEVATION 1677.607 1679.511 1678.760 1684.536 1684.911 1680.305 1680.269 1681.691 1681.586 1683.481 NODE 21 22 23 24 25 26 27 28 29 30 DEPTH 0.050 0.048 0.038 0.056 0.048 0.051 0.046 0.075 0.038 0.102 ELEVATION 1685.640 1687.828 1690.628 1691.236 1693.028 1694.701 1696.126 1696.675 1700.068 1700.142 NODE 31 32 33 34 35 36 37 38 39 40 DEPTH 0.050 0.053 0.048 0.038 0.027 0.047 0.083 0.020 0.122 0.026 ELEVATION 1702.110 1703.553 1705.478 1709.108 1711.397 1710.907 1709.673 1681.370 1671.202 1676.176
DHM Output Summary DIST PEAK AVG FROM FLOOD FLOOD PEAK DEFLOOD WAVE DAM DEPTH TIME TIME TIME VELOCITY NODE (FT) (FT) (HR) (HR) (HR) (FT/SEC) 2056 1000 9.8 0.4 3.0 6.2 6.6 1982 2000 5.6 0.9 3.1 5.8 6.5 1902 4000 6.8 1.4 3.1 5.6 7.8 1824 6000 5.2 2.4 3.2 4.8 8.4 1820 8000 3.4 3.1 3.2 3.8 10.6 1818 10000 2.6 3.2 3.2 3.5 11.7 2627 8 MI 2.2 5.3 16 64 0.8 2719 12 MI 2.1 20 25 57 0.8
There is Hope Environmental Modeling Systems, Inc. is implementing USGS DHM in their Surface Modeling System.
There is Support A new DHM web site – download the USGS report, DHM program, code, the data input program.