Download
1 / 41
440 likes | 612 Vues
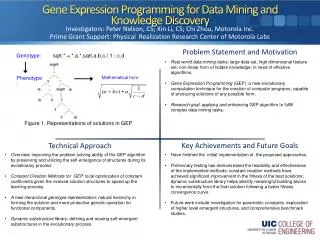
Mining Gene Co-expression Network for Cancer Biomarker Prediction. Kun Huang Department of Biomedical Informatics OSUCCC Biomedical Informatics Shared Resource. Outline. Introduction Co-expression network for Breast cancer Frequent cancer co-expression network

E N D
Mining Gene Co-expression Network for Cancer Biomarker Prediction Kun Huang Department of Biomedical Informatics OSUCCC Biomedical Informatics Shared Resource
Outline • Introduction • Co-expression network for Breast cancer • Frequent cancer co-expression network • Tissue-tissue network between stroma and tumor mass • Other applications • Chronic lymphocytic leukemia • Glioblastoma • Discussion
Correlation / co-expression • Time-course data • Bayesian network • Boolean network • …
Boolean Network Sahoo et al.Genome Biology 2008 9:R157
Gene Co-Expression HMMR siRNA
Pearson Correlation Coefficient Ranges from 1 to -1. r = 1 r = -1
Gene Co-Expression Network • Expansion • Negative correlation • Multiple breast cancer datasets • More anchor genes • … • Is there a way to find all highly correlated genes in multiple datasets? • Do these genes form clusters?
Frequent Gene Co-expression Network Mining • Genes appear in tight networks in multiple disease datasets may indicate functionally related biological modules, therefore can provide insights on the disease cell physiology and new direction for the research.
Frequent network mining • CODENSE • Search for frequent coherent densesubgraphs across large numbers of massive graphs • Unsupervised bottom-up clustering on unweighted, undirected network
Data selection and correlation • Selected 23 datasets from Gene Expression Omnibus (GEO): • Search term “metastatic cancer” • Contain both control and tumor, # sample > 8 • Only primary tumor biopsy • Correlation : │PCC│ > 0.75 (really high similarity) • For CODENSE: • Edge support appears in at least 4 datasets • Connectivity ratio r > 40% (r = L / [n(n-1)/2] ) • # of nodes > 20
Results from CODENSE • 44 networks (clusters) are identified • # of nodes: 21 ~ 74 (average 44) • Connectivity: 0.41 ~ 0.78
GO Enrichment Analysis on the Networks • Networks with enriched GO terms associated with at least 1/3 of the genes • Immune response/system – 15 • Protein translation (ribosome) – 5 • Development – 4 • Metabolism and energy (oxidative phosphorylation or monocarboxylic acid metabolism) – 3 • Cell cycle – 2 • Muscle contraction – 1 • 14 networks do NOT satisfy the above criterion • Potential new functions • New interactions
Use cluster 2 to predict survival outcome • NKI-295 dataset • Supervised clustering: k-means, k=2, 100 random initialization • Kaplan Meier curve and log-rank test for survival analysis and comparison • Test for different patient groups
Finding New Gene Functions KIAA0101
Tumor Microenvironment (TME) Kalluriet al.Nature Reviews Cancer published online 30 March 2006 | doi:10.1038/nrc1877 Cell, Volume 100, Issue 1, 7 January 2000, Pages 57-70
Bipartite Graph • Network Density (r) • For a bipartite network with M+N nodes (M nodes in one side and N nodes in the other) and K edges • r = K/MN. • For a weighted bipartite network with M+N nodes and K edges • r = Σi=1,…K Wi/MN. Tumor Stroma
Bipartite Quasi-clique Discovery Algorithm • A Greedy Algorithm • Original algorithm for quasi-clique finding is from • Ou and Zhang (2007). A new multimembership clustering method. J. of Ind. and Man. Opt., 3(4): 619-624. • Modified for the bipartite graph • Four steps: • Set the threshold on edge weight w0 = g•max(wi). • Initialize a new search: pick the edge with the maximal weight (larger than w0) that has not been assigned to any network as the first edge of a new network. • Grow: alternatively adding nodes to the network from both sides which contribute most to the network density if the contribution to the density is higher than an adaptive threshold defined by two parameters l and t; • 3.1. stop when no new node can be added; go to Step 2. • Merge: iteratively merge networks with more than 50% overlap (w.r.t. to the smaller one).
Workflow Select a breast cancer dataset from GEO: GSE5847 contains 47 samples with separate microarray data for stroma and tumor separated using laser capture microdissection Compute Pearson Correlation Coefficients (PCC) for every pair of gene between the stroma and the tumor Use the PCC values as the weights for the edges and set the three parameters g (0.7), l (2), and t(2) to run the bipartite quasi-clique finding algorithm Select the top 10 networks for further analysis
Results • Stroma-tumor network
Extracellular Matrix Network • Tumor microenvironment
Outline • Introduction • Co-expression network for Breast cancer • Frequent cancer co-expression network • Tissue-tissue network between stroma and tumor mass • Other applications • Chronic lymphocytic leukemia (CLL) • Glioblastoma • Discussion
CLL Prognostic Biomarker • CLL is the most common adult leukemia in the western world. It is highly heterogeneous, can be indolent or progressive. • Prognosis at early stage is crucial to progressive patient survival as well as to indolent patients to avoid unnecessary adverse treatment. • Biological prognostic markers: • Serum markers (TK, B2M, sCD23) • FISH cytogenetics • IgVHmutational status - Determination is time consuming and expansive • CD38 expression - Actually independent of IgVH mutational status • ZAP-70 expression - Not 100% correlated to IgVH mutational status, only accurate when patients in the progressive stage
Network 17 • 51 genes, including ZAP-70 and CD38 • r = 0.4142 • Including known ZAP-70 interacting genes - CD8A, CD3G, CD3D, CD247
Workflow of CLL Prognostic Biomarker Selection Further select prognostic biomarkers by testing on separate CLL dataset Compute gene exp level difference on IgVHmu+/- groups 40 mRMR 40 Genes with exp fold change > 1.5 p <0.05 11 Select a group of feature genes that can differentiate IgVH mu +/- groups Cross validation Test the prediction accuracy of each gene on IgVH mutation status 10 6 5 Identify potential prognostic biomarkers
Prediction of IgVH Mutational Status with Individual Genes • Two groups of patients (GDS1494): 49 IgVH mu- ; 51 IgVH mu+ • Each gene / gene set was tested independently • A linear classifier with 20% hold out and 100 repeats
Cross Check with Outcome Data • LAG3 : involved in T-cell-dependent B-cell activation, reported recently to be highly correlated to IgVH mutational status • IL2RB: involved in endocytosis and transduction of mitogenic signal of IL2, expression on B-cells was linked to CLL • CD8A and CD247: expression of CD8A on B-cells has been linked to CLL • KLRK1: involved in immune surveillance exerted by T/B-cells Using GSE10138
Functional Enrichment analysis using IPA for cluster E. The x-axis shows the log (base 10) of p-values of the enriched terms using the Fisher’s exact tests. GO Enrichment results using ToppGene for Cluster E (GO: Biological Processes)
Summary and Future Work • Gene co-expression networks provide rich information in predicting gene functions and disease mechanisms • Need to be integrated with other networks such as PPI
Summary and Future Work • Ongoing work 1: • More biological and clinical validation • Tissue microarray – at protein level • Ongoing work 2: • Multiple tissue network for TME • Microarray data for epithelial cells, fibroblast cells, endothelial cells, macrophages • Moving to RNA-seq • Ongoing work 3: • Biclique mining algorithm using frequent item set and graph summarization
Summary and Future Work • Ongoing work 4: • Integrating multiple networks – disease network, phenotype network Barabasi A-L, Network medicine – from obesity to “Diseasome”, NEJM, 357(4): 404-407, 2007.