Download
1 / 19
190 likes | 281 Vues
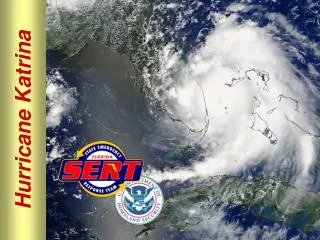
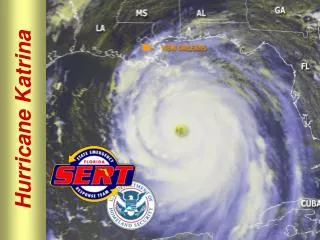
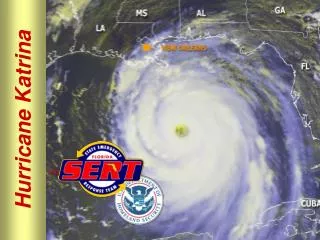
Water mass tracking from the region of Hurricane Katrina. by R.H. Weisberg, A. Alvera-Azcarate and the entire CMS-USF Ocean Circulation Group College of Marine Science, University of South Florida, St. Petersburg, FL. with Materials derived from the SEACOOS and COMPS Programs.

E N D
Water mass tracking from the region of Hurricane Katrina by R.H. Weisberg, A. Alvera-Azcarate and the entire CMS-USF Ocean Circulation Group College of Marine Science, University of South Florida, St. Petersburg, FL. with Materials derived from the SEACOOS and COMPS Programs
Products Overview The CMS-USF Ocean Circulation Group maintains a set of data products derived from the COMPS and SEACOOS Programs and available at http://ocg6.marine.usf.edu. These include sea surface temperature (SST), color (proxy for Chl), and height (SSH) derived from satellite imagery and a geostrophic surface current analysis from SSH. SST and color are processed using optimal interpolation (OI) in time and space to fill cloud gaps beginning with native grid images supplied by the CMS-USF-IMARS. SSH anomalies obtained from CLS in France are combined with a mean SSH field computed from a long term HYCOM model integration to give absolute SSH. Eulerian geostrophic surface currents are then computed from the SSH gradients and integrated in time/space to estimate Lagrangian trajectories. Also included is a daily wind field by OI blending NCEP model winds with in situ coastal winds. As experimental research products, and no claims are made on accuracy.
Snapshots of OI-Color and SSH-geoV These are updated daily for color and biweekly for SSH-geoV We see what appears to be entrainment into the Loop Current of water of Mississippi River origin beginning around September 6th. The LC as seen in the later images extends far to the west so that it is traveling toward the east just south the the Mississippi River delta.
Trajectories for particles originating between the MR Delta and the LC on August 31 and tracked with geostrophic currents from satellite-derived SSH. The biweekly Eulerian surface geostrophic current analyses are linearly interpolated between analysis intervals and the fields are then integrated in time and space to give trajectory estimates. We begin at given times with a uniform distribution of particles centered on and to the south of the Mississippi River delta. For times beyond the last analysis interval we hold the currents steady to produce the forecast. These will be updated with each new analysis interval. These trajectories include only the effects of the geostrophic currents; they omit other effects such as winds for which a complete ocean circulation model is needed.
Trajectories for particles originating between the MR Delta and the LC on September 7 and tracked with geostrophic currents from satellite-derived SSH.
Complete movie available at http://ocg6.marine.USF.edu, click on Katrina tracking tool
Forecast of water of Mississippi River origin, entrained into the LC after 9/7/05, arriving in the vicinity of the Florida Keys on 9/20/05. Colors denote sea surface height (cm). Stars are simulated particle trajectories. Complete movies available at http://ocg6.marine.usf.edu, click on Katrina tracking tool
SEACOOS domain blended wind product: NCEP model plus coastal ocean in-situ data.