Download
1 / 39
390 likes | 508 Vues
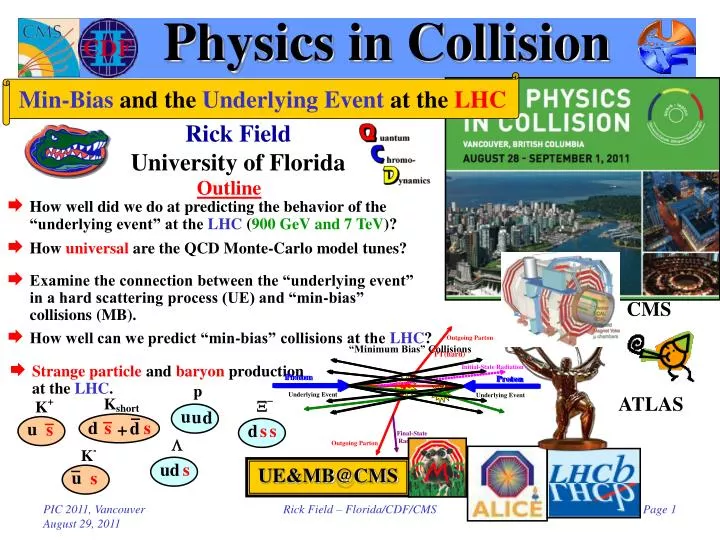
Physics in Collision. Min-Bias and the Underlying Event at the LHC. Rick Field University of Florida. Outline. How well did we do at predicting the behavior of the “underlying event” at the LHC ( 900 GeV and 7 TeV )?. How universal are the QCD Monte-Carlo model tunes?.

E N D
Physics in Collision Min-Bias and the Underlying Event at the LHC Rick Field University of Florida Outline • How well did we do at predicting the behavior of the “underlying event” at the LHC (900 GeV and 7 TeV)? • How universal are the QCD Monte-Carlo model tunes? • Examine the connection between the “underlying event” in a hard scattering process (UE) and “min-bias” collisions (MB). CMS • How well can we predict “min-bias” collisions at the LHC? • Strange particle and baryon production at the LHC. ATLAS UE&MB@CMS Rick Field – Florida/CDF/CMS
“Towards”, “Away”, “Transverse” • CDF data at 1.96 TeV on the density of charged particles, dN/dhdf, with pT > 0.5 GeV/c and |h| < 1 for “leading jet” events as a function of the leading jet pT for the “toward”, “away”, and “transverse” regions. The data are corrected to the particle level (with errors that include both the statistical error and the systematic uncertainty) and are compared with PYTHIA Tune A at the particle level (i.e. generator level). “Leading Jet” Factor of ~16 Factor of ~4.5 • CDF data at 1.96 TeV on the charged particle scalar pT sum density, dPT/dhdf, with pT > 0.5 GeV/c and |h| < 1 for “leading jet” events as a function of the leading jet pT for the “toward”, “away”, and “transverse” regions. The data are corrected to the particle level (with errors that include both the statistical error and the systematic uncertainty) and are compared with PYTHIA Tune A at the particle level (i.e. generator level). Rick Field – Florida/CDF/CMS
Charged Particle Density • CDF data at 1.96 TeV on the density of charged particles, dN/dhdf, with pT > 0.5 GeV/c and |h| < 1 for “Z-Boson” and “Leading Jet” events as a function of the leading jet pT or PT(Z) for the “toward”, “away”, and “transverse” regions. The data are corrected to the particle level and are compared with PYTHIA Tune AW and Tune A, respectively, at the particle level (i.e. generator level). Rick Field – Florida/CDF/CMS
Charged Particle Density New Large increase in the UE in going from 1.96 TeV to 7 TeV as predicted by PYTHIA Tune DW! • CDF data at 1.96 TeV on the density of charged particles, dN/dhdf, with pT > 0.5 GeV/c and |h| < 1 for Drell-Yan production as a function of PT(Z) for the “toward”, “away”, and “transverse” regions compared with PYTHIA Tune DW. CMS CDF: Proton-Antiproton Collisions at 1.96 GeV Lepton Cuts: pT > 20 GeV |h| < 1.0 Mass Cut: 70 < M(lepton-pair) < 110 GeV Charged Particles: pT > 0.5 GeV/c |h| < 1.0 CMS: Proton-Proton Collisions at 7 GeV Lepton Cuts: pT > 20 GeV |h| < 2.4 Mass Cut: 60 < M(lepton-pair) < 120 GeV Charged Particles: pT > 0.5 GeV/c |h| < 2.0 • CMS data at 7 TeV on the density of charged particles, dN/dhdf, with pT > 0.5 GeV/c and |h| < 2 for Drell-Yan production as a function of PT(Z) for the “toward”, “away”, and “transverse” regions compared with PYTHIA Tune DW. Rick Field – Florida/CDF/CMS
Charged PTsum Density • CDF data at 1.96 TeV on the charged scalar PTsum density, dPT/dhdf, with pT > 0.5 GeV/c and |h| < 1 for “Z-Boson” and “Leading Jet” events as a function of the leading jet pT or PT(Z) for the “toward”, “away”, and “transverse” regions. The data are corrected to the particle level and are compared with PYTHIA Tune AW and Tune A, respectively, at the particle level (i.e. generator level). Rick Field – Florida/CDF/CMS
Charged PTsum Density New Large increase in the UE in going from 1.96 TeV to 7 TeV as predicted by PYTHIA Tune DW! • CDF data at 1.96 TeV on the charged PTsum density, dPT/dhdf, with pT > 0.5 GeV/c and |h| < 1 for Drell-Yan production as a function of PT(Z) for the “toward”, “away”, and “transverse” regions compared with PYTHIA Tune DW. CMS • CMS data at 7 TeV on the charged PTsum density, dPT/dhdf, with pT > 0.5 GeV/c and |h| < 1 for Drell-Yan production as a function of PT(Z) for the “toward”, “away”, and “transverse” regions compared with PYTHIA Tune DW. Rick Field – Florida/CDF/CMS
PYTHIA Tune DW CMS ATLAS • ATLAS preliminary data at 900 GeV and 7 TeV on the “transverse” charged particle density, dN/dhdf, as defined by the leading charged particle (PTmax) for charged particles with pT > 0.5 GeV/c and |h| < 2.5. The data are corrected and compared with PYTHIA Tune DW at the generator level. • CMS preliminary data at 900 GeV and 7 TeV on the “transverse” charged particle density, dN/dhdf, as defined by the leading charged particle jet (chgjet#1) for charged particles with pT > 0.5 GeV/c and |h| < 2. The data are uncorrected and compared with PYTHIA Tune DW after detector simulation. Rick Field – Florida/CDF/CMS
PYTHIA Tune DW Overall PYTHIA Tune DW is in amazingly good agreement with the Tevatron Jet production and Drell-Yan data and did a very good job in predicting the LHC Jet production and Drell-Yan data! (although not perfect) CMS ATLAS • ATLAS preliminary data at 900 GeV and 7 TeV on the “transverse” charged PTsum density, dPT/dhdf, as defined by the leading charged particle (PTmax) for charged particles with pT > 0.5 GeV/c and |h| < 2.5. The data are corrected and compared with PYTHIA Tune DW at the generator level. • CMS preliminary data at 900 GeV and 7 TeV on the “transverse” charged PTsum density, dPT/dhdf, as defined by the leading charged particle jet (chgjet#1) for charged particles with pT > 0.5 GeV/c and |h| < 2. The data are uncorrected and compared with PYTHIA Tune DW after detector simulation. Rick Field – Florida/CDF/CMS
PYTHIA Tune Z1 • All my previous tunes (A, DW, DWT, D6, D6T, CW, X1, and X2) were PYTHIA 6.4 tunes using the old Q2-ordered parton showers and the old MPI model (really 6.2 tunes)! PARP(90) PARP(82) Color • I believe that it is time to move to PYTHIA 6.4 (pT-ordered parton showers and new MPI model)! Connections Diffraction • Tune Z1: I started with the parameters of ATLAS Tune AMBT1, but I changed LO* to CTEQ5L and I varied PARP(82) and PARP(90) to get a very good fit of the CMS UE data at 900 GeV and 7 TeV. • The ATLAS Tune AMBT1 was designed to fit the inelastic data for Nchg ≥ 6 and to fit the PTmax UE data with PTmax > 10 GeV/c. Tune AMBT1 is primarily a min-bias tune, while Tune Z1 is a UE tune! UE&MB@CMS Rick Field – Florida/CDF/CMS
PYTHIA Tune Z1 Parameters not shown are the PYTHIA 6.4 defaults! Rick Field – Florida/CDF/CMS
CMS UE Data CMS CMS Tune Z1 Tune Z1 • CMS preliminary data at 900 GeV and 7 TeV on the “transverse” charged PTsum density, dPT/dhdf, as defined by the leading charged particle jet (chgjet#1) for charged particles with pT > 0.5 GeV/c and |h| < 2.0. The data are corrected and compared with PYTHIA Tune Z1 at the generator level. • CMS preliminary data at 900 GeV and 7 TeV on the “transverse” charged particle density, dN/dhdf, as defined by the leading charged particle jet (chgjet#1) for charged particles with pT > 0.5 GeV/c and |h| < 2.0. The data are corrected and compared with PYTHIA Tune Z1 at the generator level. CMS corrected data! CMS corrected data! Very nice agreement! Rick Field – Florida/CDF/CMS
ATLAS UE Data ATLAS ATLAS Tune Z1 Tune Z1 • ATLAS published data at 900 GeV and 7 TeV on the “transverse” charged particle density, dN/dhdf, as defined by the leading charged particle (PTmax) for charged particles with pT > 0.5 GeV/c and |h| < 2.5. The data are corrected and compared with PYTHIA Tune Z1 at the generator level. • ATLAS published data at 900 GeV and 7 TeV on the “transverse” charged PTsum density, dPT/dhdf, as defined by the leading charged particle (PTmax) for charged particles with pT > 0.5 GeV/c and |h| < 2.5. The data are corrected and compared with PYTHIA Tune Z1 at the generrator level. ATLAS publication – arXiv:1012.0791 December 3, 2010 Rick Field – Florida/CDF/CMS
CMS-ATLAS UE Data CMS: Chgjet#1 Tune Z1 Tune Z1 ATLAS: PTmax • CMS preliminary data at 7 TeV on the “transverse” charged particle density, dN/dhdf, as defined by the leading charged particle jet (chgjet#1) for charged particles with pT > 0.5 GeV/c and |h| < 2.0 together with the ATLAS published data at 7 TeV on the “transverse” charged particle density, dN/dhdf, as defined by the leading charged particle (PTmax) for charged particles with pT > 0.5 GeV/c and |h| < 2.5 The data are corrected and compared with PYTHIA Tune Z1 at the generator level. Amazing agreement! Rick Field – Florida/CDF/CMS
ALICE UE Data ALICE ALICE Tune Z1 Tune Z1 • ALICE preliminary data at 900 GeV and 7 TeV on the “transverse” charged particle density, dN/dhdf, as defined by the leading charged particle (PTmax) for charged particles with pT > 0.5 GeV/c and |h| < 0.8. The data are corrected and compared with PYTHIA Tune Z1 at the generator level. • ALICE preliminary data at 900 GeV and 7 TeV on the “transverse” charged PTsum density, dPT/dhdf, as defined by the leading charged particle (PTmax) for charged particles with pT > 0.5 GeV/c and |h| < 0.8. The data are corrected and compared with PYTHIA Tune Z1 at the generrator level. ALICE UE Data: Talk by S. Vallero MPI@LHC 2010 Glasgow, Scotland November 30, 2010 I read the points off with a ruler! Rick Field – Florida/CDF/CMS
PYTHIA Tune Z1 Tune Z1 Tune Z1 • CMS data at 900 GeV on the “transverse” charged particle density, dN/dhdf, as defined by the leading charged particle jet (chgjet#1) for charged particles with pT > 0.5 GeV/c and |h| < 2.0. The data are corrected and compared with PYTHIA Tune Z1 at the generator level. • CDF data at 1.96 TeV on the “transverse” charged particle density, dN/dhdf, as defined by the leading calorimeter jet (jet#1) for charged particles with pT > 0.5 GeV/c and |h| < 1.0. The data are corrected and compared with PYTHIA Tune Z1 at the generator level. Rick Field – Florida/CDF/CMS
PYTHIA Tune Z1 Tune Z1 Tune Z1 • CDF data at 1.96 TeV on the “transverse” charged PTsum density, dPT/dhdf, as defined by the leading calorimeter jet (jet#1) for charged particles with pT > 0.5 GeV/c and |h| < 1.0. The data are corrected and compared with PYTHIA Tune Z1 at the generator level. • CMS data at 900 GeV and 7 TeV on the “transverse” charged PTsum density, dPT/dhdf, as defined by the leading charged particle jet (chgjet#1) for charged particles with pT > 0.5 GeV/c and |h| < 2.0. The data are corrected and compared with PYTHIA Tune Z1 at the generator level. Rick Field – Florida/CDF/CMS
PYTHIA Tune Z1 Tune Z1 describes the energy dependence fairly well! CMS • CDF data at 1.96 TeV on the density of charged particles, dN/dhdf, with pT > 0.5 GeV/c and |h| < 1 for Drell-Yan production as a function of PT(Z) for the “toward”, “away”, and “transverse” regions compared with PYTHIA Tune Z1. • CMS data at 7 TeV on the density of charged particles, dN/dhdf, with pT > 0.5 GeV/c and |h| < 2 for Drell-Yan production as a function of PT(Z) for the “toward”, “away”, and “transverse” regions compared with PYTHIA Tune Z1. Rick Field – Florida/CDF/CMS
PYTHIA Tune Z1 CMS • CDF data at 1.96 TeV on the charged PTsum density, dPT/dhdf, with pT > 0.5 GeV/c and |h| < 1 for Drell-Yan production as a function of PT(Z) for the “toward”, “away”, and “transverse” regions compared with PYTHIA Tune Z1. • CMS data at 7 TeV on the charged PTsum density, dPT/dhdf, with pT > 0.5 GeV/c and |h| < 2 for Drell-Yan production as a function of PT(Z) for the “toward”, “away”, and “transverse” regions compared with PYTHIA Tune Z1. Rick Field – Florida/CDF/CMS
PYTHIA Tune Z1 Tune Z1 Tune Z1 Tune Z1 Tune Z1 Rick Field – Florida/CDF/CMS
PYTHIA Tune Z1 Overall amazingly good agreement with the LHC and Tevatron Jet production and Drell-Yan! (although not perfect yet) Tune Z1 Tune Z1 What about Min-Bias? Tune Z1 Tune Z1 Rick Field – Florida/CDF/CMS
The Inelastic Non-Diffractive Cross-Section Occasionally one of the parton-parton collisions is hard (pT > ≈2 GeV/c) Majority of “min-bias” events! “Semi-hard” parton-parton collision (pT < ≈2 GeV/c) + + + + … Multiple-parton interactions (MPI)! Rick Field – Florida/CDF/CMS
The “Underlying Event” Select inelastic non-diffractive events that contain a hard scattering 1/(pT)4→ 1/(pT2+pT02)2 Hard parton-parton collisions is hard (pT > ≈2 GeV/c) “Semi-hard” parton-parton collision (pT < ≈2 GeV/c) The “underlying-event” (UE)! + + + … Given that you have one hard scattering it is more probable to have MPI! Hence, the UE has more activity than “min-bias”. Multiple-parton interactions (MPI)! Rick Field – Florida/CDF/CMS
Model of sND Allow leading hard scattering to go to zero pT with same cut-off as the MPI! “Semi-hard” parton-parton collision (pT < ≈2 GeV/c) 1/(pT)4→ 1/(pT2+pT02)2 Model of the inelastic non-diffractive cross section! + + + + … Multiple-parton interactions (MPI)! Rick Field – Florida/CDF/CMS
UE Tunes Allow primary hard-scattering to go to pT = 0 with same cut-off! “Underlying Event” Fit the “underlying event” in a hard scattering process. 1/(pT)4→ 1/(pT2+pT02)2 “Min-Bias” (ND) “Min-Bias” (add single & double diffraction) + + + Predict MB (ND)! + … Predict MB (IN)! Rick Field – Florida/CDF/CMS
Min-Bias Collisions ALICE INEL = NSD + SD NSD = ND + DD CMS Tune Z1 Tune Z1 • CMS NSD data on the charged particle rapidity distribution at 7 TeV compared with PYTHIA Tune Z1. The plot shows the average number of particles per NSD collision per unit h, (1/NNSD) dN/dh. • ALICE NSD data on the charged particle rapidity distribution at 900 GeV compared with PYTHIA Tune Z1. The plot shows the average number of particles per INEL collision per unit h, (1/NINEL) dN/dh. Okay not perfect, but remember we know that SD and DD are not modeled well! Rick Field – Florida/CDF/CMS
MB versus UE Divide be 2p NSD = ND + DD CMS Tune Z1 • CMS NSD data on the charged particle rapidity distribution at 7 TeV compared with PYTHIA Tune Z1. The plot shows the average number of charged particles per NSD collision per unit h, (1/NNSD) dN/dh. • CMS NSD data on the charged particle rapidity distribution at 7 TeV compared with PYTHIA Tune Z1. The plot shows the average number of charged particles per NSD collision per unit h-f, (1/NNSD) dN/dhdf. Rick Field – Florida/CDF/CMS
MB versus UE CMS Tune Z1 NSD = ND + DD Factor of 2! Tune Z1 • Shows the density of charged particles in the “transverse” region as a function of PTmax for charged particles (All pT, |h| < 2) at 7 TeV from PYTHIATune Z1. • CMS NSD data on the charged particle rapidity distribution at 7 TeV compared with PYTHIA Tune Z1. The plot shows the average number of charged particles per NSD collision per unit h-f, (1/NNSD) dN/dhdf. Rick Field – Florida/CDF/CMS
MB versus UE CMS ATLAS Tune Z1 NSD = ND + DD Factor of 2! • ATLAS data on the density of charged particles in the “transverse” region as a function of PTmax for charged particles (pT > 0.1 GeV/c, |h| < 2.5) at 7 TeV compared with PYTHIATune Z1. • CMS NSD data on the charged particle rapidity distribution at 7 TeV compared with PYTHIA Tune Z1. The plot shows the average number of charged particles per NSD collision per unit h-f, (1/NNSD) dN/dhdf. Rick Field – Florida/CDF/CMS
NSD Multiplicity Distribution Difficult to produce enough events with large multiplicity! CMS Tune Z1 • Generator level charged multiplicity distribution (all pT, |h| < 2) at 900 GeV and 7 TeV. Shows the NSD = HC + DD prediction for Tune Z1. Also shows the CMS NSD data. Okay not perfect! But not that bad! Rick Field – Florida/CDF/CMS
MB & UE “Underlying Event” “Min-Bias” CMS CMS Tune Z1 Tune Z1 Difficult to produce enough events with large multiplicity! Difficult to produce enough events with large “transverse” multiplicity at low hard scale! • CMS corrected data at 900 GeV and 7 TeV on the charged particle multiplicity distribution in the “transverse” region for charged particles (pT > 0.5 GeV/c, |h| < 2) as defined by the leading charged particle jet with PT(chgjet#1) > 3 GeV/c compared with PYTHIA Tune Z1 at the generator level. • Generator level charged multiplicity distribution (all pT, |h| < 2) at 900 GeV and 7 TeV. Shows the NSD = HC + DD prediction for Tune Z1. Also shows the CMS NSD data. Rick Field – Florida/CDF/CMS
PARP(82) PARP(90) Color Diffraction Connections How Universal are the Tunes? • Do we need a separate tune for each center-of-mass energy? 900 GeV, 1.96 TeV, 7 TeV, etc. PYTHIA Tune DW did a nice (although not perfect) job predicting the LHC Jet Production and Drell-Yan UE data. I am still hoping for a single tune that will describe all energies! • Do we need a separate tune for eachhard QCD subprocess? Jet Production, Drell-Yan Production, etc. The same tune can describe both Jet Production and Drell-Yan! • Do we need separate tunes for “Min-Bias” (MB) and the “underlying event” (UE) in a hard scattering process? PHTHIA Tune Z1 does fairly well at both the UE and MB, but you cannot expect such a naïve approach to be perfect! Rick Field – Florida/CDF/CMS
Kaon Production • CMS NSD data on the Kshort rapidity distribution at 7 TeV and 900 GeV compared with PYTHIA Tune Z1. The plot shows the average number of Kshort per NSD collision per unit Y, (1/NNSD) dN/dY. CMS INEL = NSD + SD Tune Z1 Tune Z1 • CMS NSD data on the Kshort rapidity distribution at 900 GeV and the ALICE point at Y = 0 (INEL) compared with PYTHIA Tune Z1. The ALICE point is the average number of Kshort per INEL collision per unit Y at Y = 0, (1/NINEL) dN/dY. No overall shortage of Kaons in PYTHIA Tune Z1! Rick Field – Florida/CDF/CMS
Kaon Production • ALICE INEL data on the charged kaon rapidity distribution at 900 GeV compared with PYTHIA Tune Z1. The plot shows the average number of charged kaons per INEL collision per unit Y at Y = 0, (1/NINEL) dN/dY. ALICE ALICE Tune Z1 Tune Z1 • ALICE INEL data on the charged kaon to charged pion rapidity ratio at 900 GeV compared with PYTHIA Tune Z1. No overall shortage of Kaons in PYTHIA Tune Z1! Rick Field – Florida/CDF/CMS
Particle Ratios versus PT Tails of the pT distribution. Way off due to the wrong pT! • ALICE INEL data on the charged kaon to charged pion rapidity ratio at 900 GeV compared with PYTHIA Tune Z1. • ALICE INEL data on the charged kaons to charged pions ratio versus pT at 900 GeV (|Y| < 0.75) compared with PYTHIA Tune Z1 & Z1C. PYTHIA pT dependence off on Kaons! Rick Field – Florida/CDF/CMS
Lambda Production • CMS NSD data on the Lambda+AntiLambda rapidity distribution at 7 TeV and 900 GeV compared with PYTHIA Tune Z1. The plot shows the average number of particles per NSD collision per unit Y, (1/NNSD) dN/dY. CMS Factor of 1.5! CMS Tune Z1 Tune Z1 • CMS NSD data on the Lambda+AntiLambda to 2Kshort rapidity ratio at 7 TeV compared with PYTHIA Tune Z1. Oops! Not enough Lambda’s in PYTHIA Tune Z1! Rick Field – Florida/CDF/CMS
Cascade Production • CMS NSD data on the Cascade-+AntiCascade- rapidity distribution at 7 TeV and 900 GeV compared with PYTHIA Tune Z1. The plot shows the average number of particles per NSD collision per unit Y, (1/NNSD) dN/dY. CMS CMS Factor of 2! Tune Z1 Tune Z1 • CMS data on the Cascade-+AntiCascade- to 2Kshort rapidity ratio at 7 TeV compared with PYTHIA Tune Z1. Yikes! Way too few Cascade’s in PYTHIA Tune Z1! Rick Field – Florida/CDF/CMS
Particle Ratios versus PT Too many overall protons! Tails of the pT distribution. Way off due to the wrong pT! • ALICE INEL data on the Proton+AntiProton to charged pions ratio versus pT at 900 GeV (|Y| < 0.75) compared with PYTHIA Tune Z1 & Z1C. • ALICE INEL data on the Proton+AntiProton to charged pion rapidity ratio at 900 GeV compared with PYTHIA Tune Z1 & Z1C. PYTHIA way off on the pT dependence of Protons! Rick Field – Florida/CDF/CMS
Fragmentation Summary Beam-meam remnants! Beam-meam remnants! • Strange Particle & Baryon Yields: PYTHIA is off on the overall yield of Lambda’s and Cascades (MC below the data) and too high on the proton yield. Difficult to fix this without destroying agreement with LEP! • PT Distributions: PYTHIA does not describe correctly the pT distributions of heavy particles (MC softer than the data). None of the fragmentation parameters I have looked at changes the pT distributions. Hence, if one looks at particle ratios at large pT you can see big discrepancies between data and MC (out in the tails of the distributions)! • Factorization: Are we seeing a breakdown in factorization between e+e- annihilations and hadron-hadron collisions! Is something happening in hadron-hadron collisions that does not happen in e+e- annihilations? • Herwig++ & Sherpa: Before making any conclusions about fragmentation one must check the predictions of Herwig++ and Sherpa carefully! Rick Field – Florida/CDF/CMS
Sherpa versus PYTHIA <pT> versus Mass • Before making any conclusion about e+e- versus pp collisions one must check the predictions of Herwig++ and Sherpa! Strange particle production in pp at 200 GeV (STAR_2006_S6860818) Sherpa does better than PYTHIA 8! Hendrik Hoeth http://users.hepforge.org/~hoeth/STAR_2006_S6860818/ Rick Field – Florida/CDF/CMS