Download
1 / 1
10 likes | 94 Vues
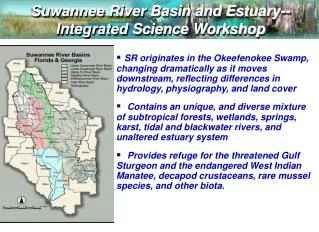
Statistical Trends of Groundwater Around the Suwannee Basin Bin Gao, Kathleen McKee, Wendy Graham, Osvaldo Gargulio.

E N D
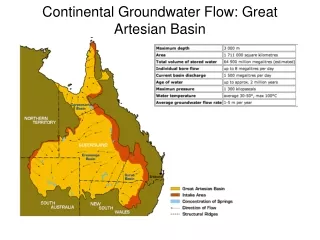
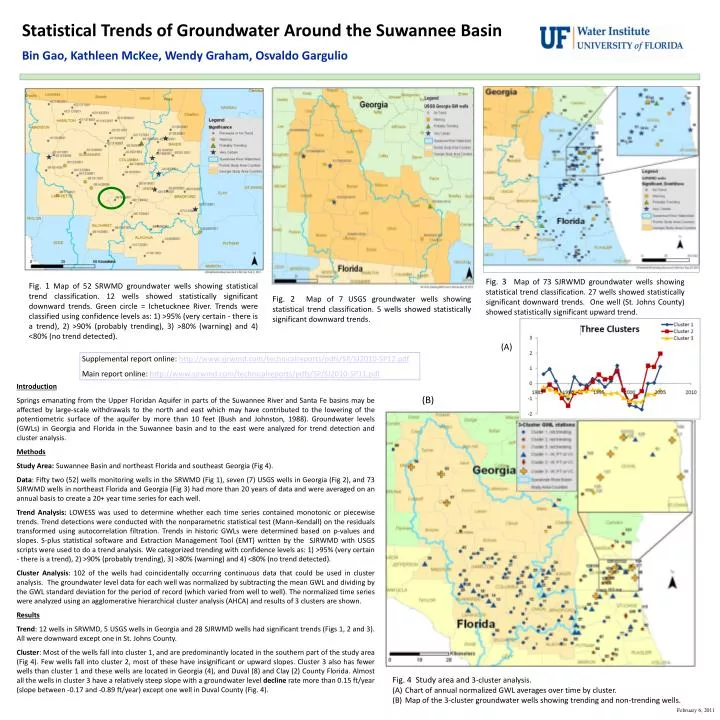
Statistical Trends of Groundwater Around the Suwannee Basin Bin Gao, Kathleen McKee, Wendy Graham, Osvaldo Gargulio Fig. 3 Map of 73 SJRWMD groundwater wells showing statistical trend classification.27 wells showed statistically significant downward trends. One well (St. Johns County) showed statistically significant upward trend. Fig. 1 Map of 52 SRWMD groundwater wells showing statistical trend classification. 12 wells showed statistically significant downward trends. Green circle = Ichetucknee River. Trends were classified using confidence levels as: 1) >95% (very certain - there is a trend), 2) >90% (probably trending), 3) >80% (warning) and 4) <80% (no trend detected). Fig. 2 Map of 7 USGS groundwater wells showing statistical trend classification. 5 wells showed statistically significant downward trends. (A) Supplemental report online: http://www.sjrwmd.com/technicalreports/pdfs/SP/SJ2010-SP12.pdf Main report online: http://www.sjrwmd.com/technicalreports/pdfs/SP/SJ2010-SP11.pdf Introduction Springs emanating from the Upper Floridan Aquifer in parts of the Suwannee River and Santa Fe basins may be affected by large-scale withdrawals to the north and east which may have contributed to the lowering of the potentiometric surface of the aquifer by more than 10 feet (Bush and Johnston, 1988). Groundwater levels (GWLs) in Georgia and Florida in the Suwannee basin and to the east were analyzed for trend detection and cluster analysis. Methods Study Area: Suwannee Basin and northeast Florida and southeast Georgia (Fig 4). Data: Fifty two (52) wells monitoring wells in the SRWMD (Fig 1), seven (7) USGS wells in Georgia (Fig 2), and 73 SJRWMD wells in northeast Florida and Georgia (Fig 3) had more than 20 years of data and were averaged on an annual basis to create a 20+ year time series for each well. Trend Analysis: LOWESS was used to determine whether each time series contained monotonic or piecewise trends. Trend detections were conducted with the nonparametric statistical test (Mann-Kendall) on the residuals transformed using autocorrelation filtration. Trends in historic GWLs were determined based on p-values and slopes. S-plus statistical software and Extraction Management Tool (EMT) written by the SJRWMD with USGS scripts were used to do a trend analysis. We categorized trending with confidence levels as: 1) >95% (very certain - there is a trend), 2) >90% (probably trending), 3) >80% (warning) and 4) <80% (no trend detected). Cluster Analysis: 102 of the wells had coincidentally occurring continuous data that could be used in cluster analysis. The groundwater level data for each well was normalized by subtracting the mean GWL and dividing by the GWL standard deviation for the period of record (which varied from well to well). The normalized time series were analyzed using an agglomerative hierarchical cluster analysis (AHCA) and results of 3 clusters are shown. Results Trend: 12 wells in SRWMD, 5 USGS wells in Georgia and 28 SJRWMD wells had significant trends (Figs 1, 2 and 3). All were downward except one in St. Johns County. Cluster: Most of the wells fall into cluster 1, and are predominantly located in the southern part of the study area (Fig 4). Few wells fall into cluster 2, most of these have insignificant or upward slopes. Cluster 3 also has fewer wells than cluster 1 and these wells are located in Georgia (4), and Duval (8) and Clay (2) County Florida. Almost all the wells in cluster 3 have a relatively steep slope with a groundwater level decline rate more than 0.15 ft/year (slope between -0.17 and -0.89 ft/year) except one well in Duval County (Fig. 4). (B) • Fig. 4 Study area and 3-cluster analysis. • Chart of annual normalized GWL averages over time by cluster. • Map of the 3-cluster groundwater wells showing trending and non-trending wells. February 6, 2011