Download
1 / 12
120 likes | 495 Vues
Hypothesis : Statement about a parameter Hypothesis testing : decision making procedure about the hypothesis Null hypothesis : the main hypothesis H 0 Alternative hypothesis : not H 0 , H 1 , H A Two-sided alternative hypothesis, uses

E N D
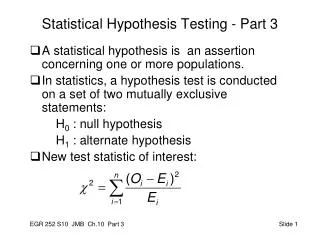
Hypothesis: Statement about a parameter Hypothesis testing: decision making procedure about the hypothesis Null hypothesis: the main hypothesis H0 Alternative hypothesis: not H0 , H1 , HA Two-sided alternative hypothesis, uses One-sided alternative hypothesis, uses > or < IME 301 and 312
Hypothesis Testing Process: • Read statement of the problem carefully (*) • Decide on “hypothesis statement”, that is H0 and HA (**) • Check for situations such as: • normal distribution, central limit theorem, • variance known/unknown, … • Usually significance level is given (or confidence level) • Calculate “test statistics” such as: Z0, t0 , , …. • Calculate “critical limits” such as: • Compare “test statistics” with “critical limit” • Conclude “accept or reject H0” IME 301 and 312
FACT H0 is trueH0 is false Accept no error Type II H0 error Decision Reject Type I no error H0 error =Prob(Type I error) = significance level = P(reject H0 | H0 is true) = Prob(Type II error) =P(accept H0 | H0 is false) (1 - ) = power of the test IME 301 and 312
The P-value is the smallest level of significance that would lead to rejection of the null hypothesis. The application of P-values for decision making: Use test-statistics from hypothesis testing to find P-value. Compare level of significance with P-value. P-value < 0.01 generally leads to rejection of H0 P-value > 0.1 generally leads to acceptance of H0 0.01 < P-value < 0.1 need to have significance level to make a decision IME 301 and 312
Test of hypothesis on mean, two-sided No information on population distribution Test statistic: Critical limit: Fail to reject H0 if or P-value = IME 301 and 312
Test of hypothesis on mean, one-sided No information on population distribution IME 301 and 312
Test of hypothesis on mean, two-sided, variance known population is normal or conditions for central limit theoremholds Test statistic: Critical limit: Fail to reject H0 if or, p-value = IME 301 and 312
Test of hypothesis on mean, one-sided, variance known population is normal or conditions for central limit theorem holds IME 301 and 312
Paired samples verses Independent samples • For Paired samples calculate the difference in samples and deal with it similar to hypothesis testing on mean of a population. IME 301 and 312
Test of hypothesis on difference of two means variances known, populations are normal or conditions for central limit theorem holds, two-sided, independent samples Null Hypothesis: Test statistics: Alternative Hypotheses Fail to Reject H0 if IME 301 and 312
Test of hypothesis on variance population is normal or conditions for central limit theorem holds, two-sided Test statistics: Fail to reject H0 if IME 312
Goodness-of-Fit Test: 1- Select intervals, k=number of intervals 2- Count number of observations in each interval Oi 3- Guess the fitted distribution 4- Decide on p = number of parameters of this distribution (if values of parameters are calculated from the sample data), otherwise p = 0. 5- Calculate expected number in each interval ei 6- Calculate Then X2 has a distribution. 7- Find P-value related to this X2 . If level of significance is greater than this P-value then reject this distribution and try another one. IME 312