Download
1 / 16
190 likes | 256 Vues
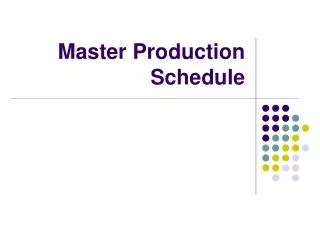
Supplement I - Master Production Scheduling. Master Production Schedule (MPS). A detailed plan that states how many end items will be produced within specified periods of time. a. End items are either finished products or the highest level assemblies from which shippable products are built.

E N D
Master Production Schedule (MPS) A detailed plan that states how many end items will be produced within specified periods of time. a. End items are either finished products or the highest level assemblies from which shippable products are built. b. Time periods are usually measured in weeks, although they may be measured in hours, days, or even months.
April May 1 2 3 4 5 6 7 8 Ladder-back chair 150 150 Kitchen chair 120 120 Desk chair 200 200 200 200 Aggregate production plan 790 550 for chair family Master Production Schedule
Constraints of MPS a. Sum of the MPS quantities must equal those of PRODUCTION PLAN b. Total requirements for a product must be allocated over time in an efficient manner. Considerations involved are: • Cost of production setups • Inventory carrying costs c. CAPACITY LIMITATION must be recognized.
Authorized production plan Prospective master production schedule Material requirements planning Authorized master production schedule MPS Process No Are resources available? Yes Figure I.1
Developing an MPS: I t = It-1 + MPSt - max (Ft or COt ) where I t = projected on-hand inventory in week t MPSt =MPS quantity due in week t Ft = Forecast of orders in week t COt = customer orders already booked for shipment in week t
17 chairs Inventory = + - = ( ) ( ) 38 chairs already promised for delivery in week 1 ( ) 55 chairs currently in stock MPS quantity (0 for week 1) Developing an MPS Item: Ladder-back chair April Quantity On Hand: 1 2 30 30 38 27 17 -13 0 0 55 Figure I.2 Forecast Explanation: Forecast is less than booked orders in week 1; projected on-hand inventory balance = 55 + 0 - 38 = 17. Customer orders (booked) Projected on-hand Inventory Explanation: Forecast exceeds booked orders in week 2; projected on-hand inventory balance = 17 + 0 - 30 = -13. The shortage signals a need to schedule an MPS quantity for completion in week 2. MPS quantity MPS start
Master Production Schedule Order Policy: 150 units Lead Time: 1 week Item: Ladder-back chair April May Quantity on Hand: 55 1 2 3 4 5 6 7 8 Forecast 30 30 30 30 35 35 35 35 Customer orders (booked) 38 27 24 8 0 0 0 0 Projected on-hand inventory 17 137 Explanation: On-hand inventory balance = 17 + 150 - 30 = 137. The MPS quantity is needed to avoid a shortage of 30 - 17 = 13 chairs in week 2. MPS quantity 0 150 MPS start Figure I.3
Master Production Schedule Order Policy: 150 units Lead Time: 1 week Item: Ladder-back chair April May Quantity on Hand: 55 1 2 3 4 5 6 7 8 Forecast 30 30 30 30 35 35 35 35 Customer orders (booked) 38 27 24 8 0 0 0 0 Projected on-hand inventory 17 137 Explanation: The time needed to assemble 150 chairs is one week. The assembly department must start assembling chairs in week 1 to have them ready by week 2. MPS quantity 0 150 MPS start 150 Figure I.3
Available-to-Promise Quantities (ATP) a. Concept Amount of MPS that can still use to meet new booking requests, considering current on-hand, MPSt , and COt b. First Week: ATP=current OH + MPS in first week - cumulative COt up to next MPS receipt c. Subsequent Weeks: Only for weeks when an MPS quantity arrives. ATP= MPS of the week - cumulative COt up to next MPS receipt
Order Policy: 150 units Lead Time: 1 week Item: Ladder-back chair Available to Promise April May Quantity on Hand: 55 1 2 3 4 5 6 7 8 Forecast 30 30 30 30 35 35 35 35 Customer orders (booked) 38 27 24 8 0 0 0 0 Projected on-hand inventory 17 137 107 77 42 7 122 87 Explanation: The total of customer orders booked until the next MPS receipt is 38 units. The ATP = 55 (on-hand) + 0 (MPS quantity) - 38 = 17. MPS quantity 0 150 0 0 0 0 150 0 MPS start 150 0 0 0 0 150 0 0 Available-to-promise (ATP) inventory 17 Figure I.4
Order Policy: 150 units Lead Time: 1 week Item: Ladder-back chair Available to Promise April May Quantity on Hand: 55 1 2 3 4 5 6 7 8 Forecast 30 30 30 30 35 35 35 35 Customer orders (booked) 38 27 24 8 0 0 0 0 Projected on-hand inventory 17 137 107 77 42 7 122 87 Explanation: The total of customer orders booked until the next MPS receipt is 27 + 24 + 8 = 59 units. The ATP = 150 (MPS quantity) - 59 = 91 units. MPS quantity 0 150 0 0 0 0 150 0 MPS start 150 0 0 0 0 150 0 0 Available-to-promise (ATP) inventory 17 91 Figure I.4
Order Policy: 80 units Item: 3-in. gate valve April May Quantity 45 on Hand: 1 2 3 4 5 6 7 8 Forecast 20 20 20 20 40 40 40 40 Customer orders 23 15 8 4 0 0 0 0 (booked) Projected on-hand 22 2 62 42 2 42 2 42 inventory MPS quantity 0 0 80 0 0 80 0 80 ATP inventory 7 68 80 80 ATP Calculation
ATP Order-Acceptance Example Based on the previous slide, should the following orders be accepted? Order Amount (units) Week Requested 1 5 2 2 38 5 3 24 3 4 15 4
Order Policy: 80 units Item: 3-in. gate valve April May Quantity 45 on Hand: 1 2 3 4 5 6 7 8 Forecast 20 20 20 20 40 40 40 40 Customer orders 23 20 32 4 38 0 0 0 (booked) Projected on-hand 22 2 50 30 -10 30 -10 30 inventory MPS quantity 0 0 80 0 0 80 0 80 ATP inventory 2 6 80 80 Updated ATP
Freezing the MPS Week 1 2 3 4 5 6 7 8 9 10 0 150 0 0 0 0 150 0 0 0 MPS quantity Demand time fence Planning time fence Figure I.5