Download
1 / 18
180 likes | 1.32k Vues
Multilevel Modeling Using HLM and MLwiN. Xiao Chen UCLA Academic Technology Services. Hierarchical Data Structure. Organizational studies Students nested in schools and variables are measured at both student level and school level Repeated measures

E N D
Multilevel Modeling Using HLM and MLwiN Xiao Chen UCLA Academic Technology Services
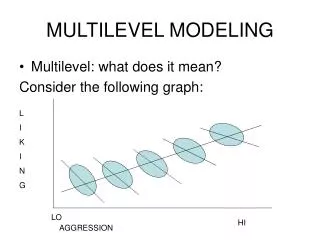
Hierarchical Data Structure • Organizational studies • Students nested in schools and variables are measured at both student level and school level • Repeated measures • Multiple observations are collected over time on each person • Doubly nested • Multiple observations are nested in individuals and individuals are nested within organizations
Statistical Treatment of Clustered Data • Aggregation • Moving variables from student level to school level • Shift of meaning • Ecological fallacy • Relationships observed for groups necessarily hold for individuals • Neglecting the original data structure • Disaggregation • Moving variables from school level to student level • Both macro level and micro level variables exist in the model • Data has only micro level variables
What can Multilevel Modeling do? • Improving estimation of effects within individual units • Hypotheses testing about cross-level effects • Partitioning of variance and covariance components among levels
HLM Under development since mid 1980’s First window version came out in 1997 Version 6 in September 2004 Run on Windows95/98/NT/Me/2000/XP Minimum 2 MB of RAM and 2 MB of disk space MLwiN Based on MLn First released in 1997 Version 2 in 2004 Run on Windows 95/98/NT/Me/2000/XP 32 Mb of Ram or more A hard disk with at least 20MB of available space Overview of HLM and MLwiN
HLM Graphical interface Continuous outcome Binary, count outcome Multivariate outcome variables Cross-classified data Sample weights Number of levels: 3 MLwiN Graphical interface Continuous outcome Binary, count outcome Multivariate outcome variables Cross-classified data Sample weights Number of levels: can be many (default is 5) Continued
HLM Use a level-1 data set and a level-2 data set for creating an .mdm file (mdmt stands for multivariate data matrix) Read SAS, SPSS, STATA and SYSTAT files directly Built-in Stat/transfer for many different data types Use mdm file for computation, very efficient Use raw data sets for graphics MLwiN One single file ASCII file Native MLwiN format (.ws extension) Stata2mlwin program for stata users Set-up the size of worksheet (memory control) Inputting Data
HLM Length of a variable name is 8 No data management Predictor variables can be either grand-mean centered or group-mean centered Cross-level interaction is naturally built Summary statistics created when .mdm file is created MLwiN Can create new variables Categorical variables can be dummied automatically Summary statistics Cross-level interaction variable has to be created before building up a model Data Management
Graphics for Exploring Data: HLM (Data-based graphs): line plots, scatter plots, and box plots
Reference and Site(s) • Ming Yang, Review of HLM 5.04 for Windows: http://multilevel.ioe.ac.uk/softrev/reviewhlm5.pdf • Andy Jones, A review of random effects models in MLwiN (version 2.0): http://multilevel.ioe.ac.uk/softrev/reviewmlwin.pdf • MLwiN 2 user’s manual: http://multilevel.ioe.ac.uk/download/userman20.pdf • Goldstein, Tutorial in Biostatistics Multilevel modeling of medical data http://media.wiley.com/product_data/excerpt/08/04700237/0470023708.pdf • Singer and Willett: Applied Longitudinal Data Analysis: Modeling Change and Event Occurrence: http://gseacademic.harvard.edu/~alda/ • http://www.ats.ucla.edu/stat/