Download
1 / 23
230 likes | 326 Vues
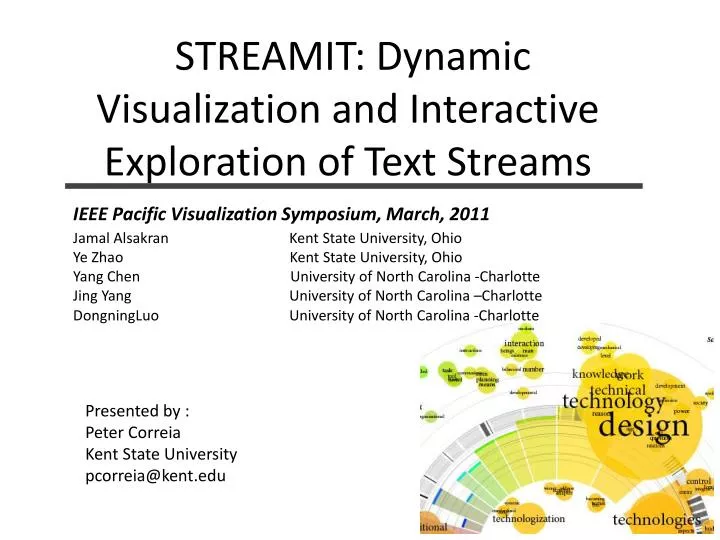
STREAMIT: Dynamic Visualization and Interactive Exploration of Text Streams. IEEE Pacific Visualization Symposium, March, 2011. Jamal Alsakran Kent State University, Ohio Ye Zhao Kent State University, Ohio

E N D
STREAMIT: Dynamic Visualization and Interactive Exploration of Text Streams IEEE Pacific Visualization Symposium, March, 2011 Jamal Alsakran Kent State University, Ohio Ye Zhao Kent State University, Ohio Yang Chen University of North Carolina -Charlotte Jing Yang University of North Carolina –CharlotteDongningLuo University of North Carolina -Charlotte Presented by : Peter Correia Kent State University pcorreia@kent.edu
Outline • Introduction - Need - Challenges • SREAMIT System -System Overview -Force-Based Dynamic System -Dynamic Keyword Importance -Visualization And Interaction • Case Studies • Performance Optimization • Conclusion • References http://www.visualcomplexity.com/vc/project_details.cfm?id=303&index=40&domain=Knowledge%20Networks
Need • Explore huge data set • Adapt data of dynamic and increasing nature • Need for efficient processing and analysis • Topics not known in advance ???
Challenges • Temporal evolution • Real time processing required • No priori knowledge of data • Providing user interaction for adjusting or changing
Outline • Introduction -Need -Challenges • SREAMIT System - System Overview - Force-Based Dynamic System - Dynamic Keyword Importance - Visualization And Interaction • Case Studies • Performance Optimization • Conclusion • References
SREAMIT System • Continual evolvement • Dynamic processing • Interactive exploration • Scalable optimization • Dynamic visualization and animation • Interaction
Force-Based Dynamic System • Potential energy between pairs of document particles: • Ideal distance computed from document similarity : Cosine similarity -> • Similar documents -> smaller ideal distance -> move documents closer to form clusters
Dynamic Keyword Importance Importance freely modified by users at any time: - According to interest/preference - According to discovered knowledge from prior period -Tool to manipulate layout and analyze data http://1.bp.blogspot.com/-h3A-2loNOlc/TaVLolzEdvI/AAAAAAAAAO0/QZ_vPq9PeJw/s1600/Ignorance_vs_Knowledge_by_casperium.jpg
User Interaction • Adjusting Keyword Importance • Browsing and Tracking Keywords • Selection • Integrated shoebox for details
Outline • Introduction -Need -Challenges • SREAMIT System -System Overview -Force-Based Dynamic System -Dynamic Keyword Importance -Visualization And Interaction • Case Studies • Performance Optimization • Conclusion • References
Case Study: New York Times News • Total article number: 230 • Time period Jul. 19 and Sep. 18, 2010 • About Barack Obama • Articles continuously injected, new keywords added to the keyword table, and their frequencies are updated on-the-fly • Keyword importance automatically assigned
Case Study: New York Times News 136 news articles High frequency keywords:“Politics and Government”, “International Relations”, “Terrorism”
Case Study: New York Times News Increase the importance of “International Relations”. Highlight the group with “Afghanistan War” in pink halo (2)“Terrorism” in orange halo (3)
Outline • Introduction -Need -Challenges • SREAMIT System -System Overview -Force-Based Dynamic System -Dynamic Keyword Importance -Visualization And Interaction • Case Studies • Performance Optimization • Conclusion • References
Outline • Introduction -Need -Challenges • SREAMIT System -System Overview -Force-Based Dynamic System -Dynamic Keyword Importance -Visualization And Interaction • Case Studies • Performance Optimization • Conclusion • References
Conclusion STREAMIT: An efficient visual exploration system for live text streams -Dynamic physical system -Keyword manipulation with importance -Visual tools
Outline • Introduction -Need -Challenges • SREAMIT System -System Overview -Force-Based Dynamic System -Dynamic Keyword Importance -Visualization And Interaction • Case Studies • Performance Optimization • Conclusion • References
References [1] C. Albrecht-Buehler, B.Watson, and D. Shamma. Visualizing live text streams using motion and temporal pooling. IEEE Computer Graphics and Applications, 25(3):52–59, June 2005. [2] K. Andrews, W. Kienreich, V. Sabol, J. Becker, G. Droschl, F. Kappe, M. Granitzer, P. Auer, and K. Tochtermann. The infosky visual explorer: Exploiting hierarchical structure and document similarities. Information Visualization, 1(3):166–181, Dec. 2002. [3] U. Brandes and S. Corman. Visual unrolling of network evolution and the analysis of dynamic discourse. Information Visualization, 2(1):40– 50, 2003. [4] M. Chalmers. A linear iteration time layout algorithm for visualising high-dimensional data. In Proceedings of the 7th conference on Visualization ’96, 1996. [5] Y. Chen, L.Wang,M. Dong, and J. Hua. Exemplar-based visualization of large document corpus (infovis2009-1115). IEEE Transactions on Visualization and Computer Graphics, 15(6):1161–1168, 2009. [6] Y. Frishman and A. Tal. Online dynamic graph drawing. IEEE Transactions on Visualization and Computer Graphics, 14(4):727– 740, Aug. 2007. [7] T. Fruchterman and E. Reingold. Graph drawing by force-directed placement. Software - Practice and Experience, 21(11):1129–1164, Nov. 1991. [8] M. Ghoniem, D. Luo, J. Yang, andW. Ribarsky. Newslab: Exploratory broadcast news video analysis. In Proceedings of the 2007 IEEE Symposium on Visual Analytics Science and Technology, pages 123–130, 2007. [9] J. Han and M. Kamber. Data mining: concepts and techniques, 2nd Edition. Morgan Kaufmann, San Francisco, CA, USA, 2006. [10] S. Havre, P. Whitney, and L. Nowell. Themeriver: Visualizing thematic changes in large document collections. IEEE Transactions on Visualization and Computer Graphics, 8:9–20, 2002. [11] E. G. Hetzler, V. L. Crow, D. A. Payne, and A. E. Turner. Turning the bucket of text into a pipe. In Proceedings of IEEE Symposium on Information Visualization, page 12, Washington, DC, USA, 2005. IEEE Computer Society. 12] Y. Ishikawa and M. Hasegawa. T-scroll: Visualizing trends in a timeseries of documents for interactive user exploration. Lecture Notes in Computer Science, 4675:235–246, Nov. 2007. [13] J. Leskovec, L. Backstrom, and J. Kleinberg. Meme-tracking and the dynamics of the news cycle. In Proceedings of the 15th ACMSIGKDD international conference on Knowledge discovery and data mining, pages 497–506, 2009. [14] S. Liu, M. X. Zhou, S. Pan, W. Qian, W. Cai, and X. Lian. Interactive, topic-based visual text summarization and analysis. In Proceeding of the 18th ACM conference on Information and knowledge management, pages 543–552, 2009. [15] D. Luo, J. Yang, M. Krstajic, J. Fan,W. Ribarsky, and D. Keim. Eventriver: An event-based visual analytics approach to exploring large text collections with a temporal focus. In IEEE Transactions on Visualization and Computer Graphics, To appear. [16] H. Luo, J. Fan, Y. Gao, W. Ribarsky, and S. Satoh. Large-scale news video retrieval via visualization. In in ACM Multimedia, pages 783– 784, 2006. [17] A. Morrison, G. Ross, and M. Chalmers. A hybrid layout algorithm for sub-quadratic multidimensional scaling. In Proc. IEEE Symposium on Information Visualization, pages 152–158, 2002. [18] L. Nyland, M. Harris, and J. Prins. Fast n-body simulation with cuda. In GPU Gems 3. [19] F. Paulovich and R. Minghim. Hipp: A novel hierarchical point placement strategy and its application to the exploration of document collections. IEEE Transaction on Visualization and Computer Graphics, 16(8):1229–1236, Nov. 2008. [20] D. C. Rapaport. The Art of Molecular Dynamics Simulation. Cambridge University Press, New York, NY, USA, 1996. [21] G. Salton and C. Buckley. Term-weighting approaches in automatic text retrieval. Information Processing and Management, 24(5):513– 523, 1988. [22] F. B. Viegas, S. Golder, and S. Donath. Visualizing email content: portraying relationships from conversational histories. In Proceedings of the SIGCHI conference on Human Factors in computing systems, pages 543–552, 2006. [23] J. A.Wise, J. J. Thomas, K. Pennock, D. Lantrip, M. Pottier, A. Schur, and V. Crow. Visualizing the non-visual: spatial analysis and interaction with information for text documents. pages 442–450, 1999. [24] P. C. Wong, H. Foote, D. Adams, W. Cowley, and J. Thomas. Dynamic visualization of transient data streams. IEEE Symposium on Information Visualization, 0:13, 2003. [25] J. Yang, D. Luo, and Y. Liu. Newdle: Interactive visual exploration of large online news collections. IEEE Computer Graphics and Applications, 30:32–41, 2010.
Acknowledgment National Science Foundation IIS-0915528, IIS-0916131 and NSFDACS10P1309.