Download
1 / 27
280 likes | 436 Vues
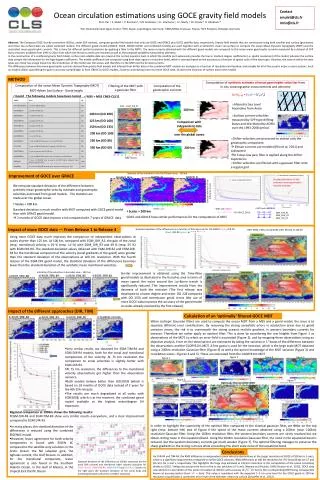
Dynamic Ocean Topography from GOCE Some Preparatory Attempts. A. Albertella, R. Rummel, R. Savcenko, W. Bosch, T. Janjic, J.Schroeter, T. Gruber, J. Bouman IAPG München, DGFI München, AWI Bremerhaven. GEOTOP project Deutschen Forschungsgemeinschaft German Priority Research Program SPP1257

E N D
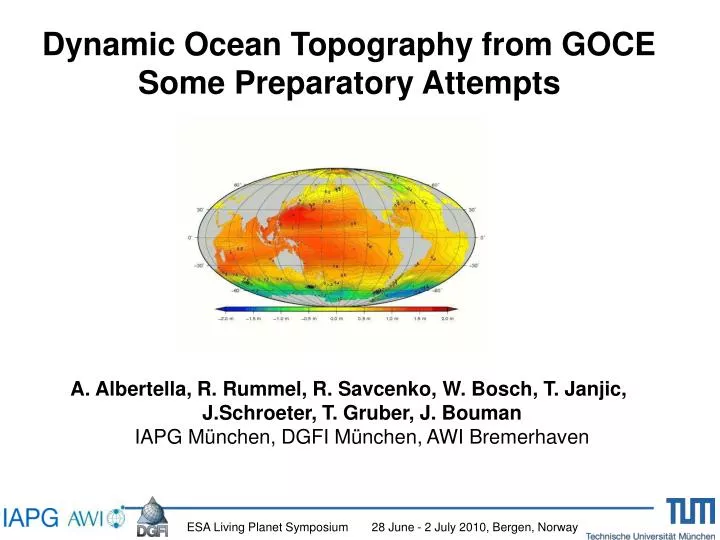
Dynamic Ocean Topography from GOCE Some Preparatory Attempts A. Albertella, R. Rummel, R. Savcenko, W. Bosch, T. Janjic, J.Schroeter, T. Gruber, J. BoumanIAPG München, DGFI München, AWI Bremerhaven ESA Living Planet Symposium 28 June - 2 July 2010, Bergen, Norway
GEOTOP project Deutschen Forschungsgemeinschaft German Priority Research Program SPP1257 • IAPG München: geodesy • IPG Dresden: geodesy • DGFI München: altimetry • AWI Bremerhaven: oceanography ESA Living Planet Symposium 28 June - 2 July 2010, Bergen, Norway
To determine the ocean circulation and its mass and heat transport assimilation of geodetic data of the dynamic ocean topography and oceanographic in-situ data This objective is possible thank to the gravity missions GRACE + GOCE ESA Living Planet Symposium 28 June - 2 July 2010, Bergen, Norway
Computation of a “geodetic” DOT from GRACE/GOCE geoid models and multi-mission altimeter data • Adaptation this geodetic DOT to an ocean circulation model • Assimilation the geodetic DOT together in-situ oceanographic data into the ocean model • Determination of the mass and heat transport • Comparison and analysis of the geodetic DOT and the oceanographic DOT obtained from the ocean circulation model runs ESA Living Planet Symposium 28 June - 2 July 2010, Bergen, Norway
H = h-N H = dynamic ocean topography ( ~ ±2 m) h = sea surface height (from altimetric measurements) N = geoid height (from recent geoid models) ESA Living Planet Symposium 28 June - 2 July 2010, Bergen, Norway
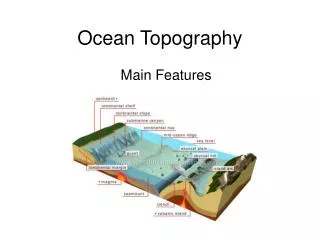
Distribution of the geodetic data Topex-Poseidon ground tracks EGM96 geoid model (Lmax = 360) ESA Living Planet Symposium 28 June - 2 July 2010, Bergen, Norway
SPECTRUM of the data GEOID: spherical harmonic representation ESA Living Planet Symposium 28 June - 2 July 2010, Bergen, Norway
SPECTRUM of the data ALTIMETRY: discrete data along ground tracks • Sea surface anomaly along one track of Topex-Poseidon mission: • black lines tracks at different time • red line on 2004/12/26 (tsunami event) ESA Living Planet Symposium 28 June - 2 July 2010, Bergen, Norway
spatial represention global regional local spatial represention global regional local long wavelength short spectral representation long wavelength short spectral representation geoid undulation sea surface height (altimetry) The data have different distribution and different spectral resolution ESA Living Planet Symposium 28 June - 2 July 2010, Bergen, Norway
H = h-N the data are not consistent! Different distribution different representation different definition of their spectrum The high frequencies present in h contain dynamic ocean topography and a high frequency geoid part To have control on the error propagation it is necessary to have consistent data (= covering the same spectral range) It is necessary to filter the data with minimum possible signal attenuation ESA Living Planet Symposium 28 June - 2 July 2010, Bergen, Norway
ESA Living Planet Symposium 28 June - 2 July 2010, Bergen, Norway
Our two different approachesfor the DOT computation • GLOBAL approach: make altimetric data, which have a local distribution, “global” extending the data also in the land areas (IAPG) • PROFILE approach: filtering the altimetric data along the satellite tracks (DGFI) ESA Living Planet Symposium 28 June - 2 July 2010, Bergen, Norway
First preliminary corrections • Reference system (Topex or GRS80 ellipsoid) • Tide system: zero tide, mean tide (altimetry) or tide free (ITG03) • Coordinates: ellipsoidal (altimetry) or spherical (geodesy and oceanography) ESA Living Planet Symposium 28 June - 2 July 2010, Bergen, Norway
Global approach ESA Living Planet Symposium 28 June - 2 July 2010, Bergen, Norway
Global approach ESA Living Planet Symposium 28 June - 2 July 2010, Bergen, Norway
sea land altimetry synthesis joint SHA Global approach SHS ESA Living Planet Symposium 28 June - 2 July 2010, Bergen, Norway
Global approach • Sea surface and geoid are expressed in series of spherical harmonic functions • The same filter up to a certain degree can be applied • Jekeli-Wahr filter ESA Living Planet Symposium 28 June - 2 July 2010, Bergen, Norway
Profile approach • Spectral filtering of geoid heights applying 2DJW(Nsh) • Spatial filtering of sea surface heights to achieve spectral consistency 1D(hi) • Filter correction to consider differences between spectral and along track filtering • (2DJW[NSH]i-1DJW[Ni]) • Computation of filtered DOT • =1D(hi) - 2DJW(Nsh) + (2DJW[NSH]i-1DJW[Ni]) 18 ESA Living Planet Symposium 28 June - 2 July 2010, Bergen, Norway
ESA Living Planet Symposium 28 June - 2 July 2010, Bergen, Norway 422nd cycle of TOPEX/Poseidon and 79th cycle of Jason-1
Geoid = ITG-Grace03 Gravity Field Model (TU Bonn) data from 09/2002 to 04/2007 no a-priori information only satellite data maximum degree L =180 full Variance-Covariance matrix (VCM) Altimetry 2004 Missions Topex and Jason data ESA Living Planet Symposium 28 June - 2 July 2010, Bergen, Norway
global approach profile approach Differences few cm open ocean ± 40 cm along coastline ESA Living Planet Symposium 28 June - 2 July 2010, Bergen, Norway
ESA Living Planet Symposium 28 June - 2 July 2010, Bergen, Norway
Filter up L=60 ESA Living Planet Symposium 28 June - 2 July 2010, Bergen, Norway
Filter up L=120 ESA Living Planet Symposium 28 June - 2 July 2010, Bergen, Norway
Data assimilation • Assimilation is carried out column by column of ocean model (FEOM) using a type of ensemble Kalman filter algorithm (LSEIK). • Only data in radius of 900 km are considered for each column assimilation. • Observational increment is weighted by function that approximates Gaussian of 245 km. • Result is DOT that reflects the influence of the geodetic DOT data used and ocean model parameterization. ESA Living Planet Symposium 28 June - 2 July 2010, Bergen, Norway
ESA Living Planet Symposium 28 June - 2 July 2010, Bergen, Norway
Conclusions • Differences between the global and profile approach • Improve the filtering, specially along the coastline • Full error propagation (geoid + altimetry) to DOT • Spectral consistency of geodetic DOT and ocean model • Comparative analysis of geodetic and oceanographic mean dynamic ocean topography ESA Living Planet Symposium 28 June - 2 July 2010, Bergen, Norway