Download
1 / 16
160 likes | 263 Vues
Idaho’s Private Forests, Ranches And Farms. Natural Resources Interim Committee July 31, 2009. Private Working Lands - 2008. Idaho Population. 1955 Benchmark 2008 Census estimate 2030 Census forecast Change ~ 500K 1990-2008 2008-2030. Land Conversion Studies.

E N D
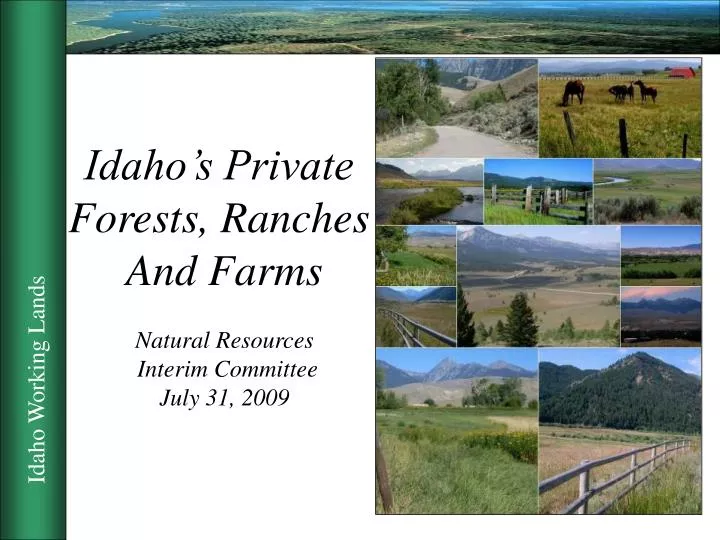
Idaho’s Private Forests, Ranches And Farms Natural Resources Interim Committee July 31, 2009
Idaho Population • 1955 Benchmark • 2008 Census estimate • 2030 Census forecast • Change ~ 500K • 1990-2008 • 2008-2030
Land Conversion Studies • Forests on the Edge - 2007 • Strategic Ranchland - 2000 • Farmland on the Edge - 2002
Forests on the Edge • Phase I • Forecasts conversion of private forestland • By watershed • 2000-2030 • Phase II • Focus on private land adjacent to national forests • Published 2007 • Statewide Assessment of Forest Resources • In process • IDL using Phase II methods
North Idaho Example 2000 2030
Strategic Ranchland • Seven States • Conversion risk 2020 • Idaho Counties in West’s top 25 • Bingham 336K • Idaho 325K • Cassia 275K • American Farmland Trust
Farmland on the Edge • 2002 Study • Identifies Growth Pattern • Based on past development • High quality • High development (red) • Low development (green) • Source • American Farmland Trust
Conversion Impacts • Fragments Private Land & Displaces • Economic contribution • Demand for support services • Habitat for game and non-game species • Access to public land • Water – rural to urban uses • Property tax revenue vs. service costs • Amenities that attracted growth
Economic Contribution • Private land • Product sales • Direct & indirect • Economic base • Support services • Agriculture - >$20 • Wildlife • Recreation related purchases
Wildlife Habitat • Idaho Wildlife Strategy • Focal Areas • Species of conservation need • Habitat includes private and public land
State Policy Tools • Common issue in Western States • Market forces drive conversion • Real estate vs. production land value • Policy Trends • Market based incentives • Conservation easements – voluntary agreements • Partial funding by state, match to external funds • Revenue source and administration varies
Incentives Market vs. Production Value
Habitat Montana • Funding - nonresident licenses • 223,800 acres • $23 million over 20 years • Wyoming Wildlife and Natural Resources Trust • Funding - permanent account, donations, appropriations • $14 million since 2006 • Match Ratio: $6.50/$1 • Utah Critical Land Conservation Fund • Up to 50% of easement cost • Match Ratio: $5/$1 • Nevada Conservation Bond • 2002 voter approved • Objective – match external sources • $6 million/year • New Mexico Income Tax Credit • Transferrable • 50% of cost