Download
1 / 46
480 likes | 653 Vues
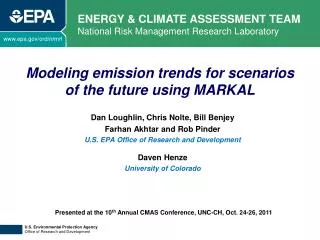
Modeling emission trends for scenarios of the future using MARKAL. Dan Loughlin, Chris Nolte, Bill Benjey Farhan Akhtar and Rob Pinder U.S. EPA Office of Research and Development Daven Henze University of Colorado. Presented at the 10 th Annual CMAS Conference, UNC-CH, Oct. 24-26, 2011.

E N D
Modeling emission trends for scenarios of the future using MARKAL Dan Loughlin, Chris Nolte, Bill Benjey FarhanAkhtar and Rob Pinder U.S. EPA Office of Research and Development DavenHenze University of Colorado Presented at the 10th Annual CMAS Conference, UNC-CH, Oct. 24-26, 2011
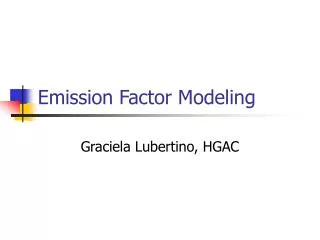
Purpose of presentation Describe the use of the MARKetALlocation (MARKAL) energy system model to develop long-term emission projections for alternative scenarios of the future
Notes • Abbreviations are defined in the extra slides at the end of the presentation • Results are provided for illustrative purposes only • DISCLAIMER: The views expressed in this presentation are those of the authors and do not necessarily reflect the views or policies of the U.S. Environmental Protection Agency or the University of Colorado
Presentation outline • Part 1. Overview of MARKAL • Assumptions • Scope and detail • Outputs • Use • Part 2. Generating CMAQ-ready future emissions • Translation of MARKAL emissions into growth-and-control factors • Use of growth-and-control factors in developing future air quality modeling inventories • Part 3. On the horizon: GLIMPSE • Example results
Overview of MARKAL Modeling U.S. energy system scenarios with MARKAL Outputs Technology pathway Fuel use Criteria air pollutant emissions Greenhouse gas (GHG) emissions Short-lived climate forcer (SLCF) emissions and radiative impact Scenario assumptions Population growth Economy Climate change Technology development Behavior Policies MARKAL energy system model and U.S. EPA MARKAL database
Overview of MARKAL: Assumptions Modeling U.S. energy system scenarios with MARKAL Baseline assumptions Data sources include: U.S. EIA: Annual Energy Outlook 2010 Commercial Building Energy Consumption Survey Residential Energy Consumption Survey Transportation Energy Data Book U.S. EPA: eGRID database AP-42 emission factors Greenhouse Gas Inventory Speciate database Regulatory impact assessments MOVES model Other: Argonne’s GREET model Scientific literature Outputs Technology pathway Fuel use Criterial air pollutant emissions Greenhouse gas (GHG) emissions Short-lived climate forcer (SLCF) emissions and radiative impact Scenario assumptions Population growth Economy Climate change Technology development Behavior Policies MARKAL energy system model
Overview of MARKAL: Scope and detail Modeling U.S. energy system scenarios with MARKAL Energy system in MARKAL Outputs Technology pathway Fuel use Criterial air pollutant emissions Greenhouse gas (GHG) emissions Short-lived climate forcer (SLCF) emissions and radiative impact Scenario assumptions Population growth Economy Climate change Technology development Behavior Policies Primary energy Processing and conversion of energy carriers End-use sectors MARKAL energy system model
Overview of MARKAL: Scope and detail Modeling U.S. energy system scenarios with MARKAL Energy system in MARKAL Outputs Technology pathway Fuel use Criterial air pollutant emissions Greenhouse gas (GHG) emissions Short-lived climate forcer (SLCF) emissions and radiative impact Scenario assumptions Population growth Economy Climate change Technology development Behavior Policies • The full energy system diagram represented in MARKAL is much larger than this. For example, the U.S. EPA 9-Region MARKAL database includes: • 98 energy service demands (x9, one for each region) • 346 residential and commercial technologies (x9) • 149 transportation technologies (x9) • 527 industrial technologies across 12 industries (x9) • 48 electricity production technologies (x9) • 38 other conversion technologies (x9) • 462 resource extraction steps • More than 11,000 components • MARKAL is also an inter-temporal model, representing the energy system in time steps over the 2005-to-2055 time horizon. This allows the evolution of the system to be modeled over a multi-decadal period.
Overview of MARKAL: Scope and detail Modeling U.S. energy system scenarios with MARKAL Why energy? Outputs Technology pathway Fuel use Criterial air pollutant emissions Greenhouse gas (GHG) emissions Short-lived climate forcer (SLCF) emissions and radiative impact Scenario assumptions Population growth Economy Climate change Technology development Behavior Policies • Air quality • Contributions to U.S. anthropogenic emissions: • NOx – 95% • SO2 – 89% • CO – 95% • Hg – 87% • Climate change • Contributes 94% of U.S. anthropogenic CO2 emissions • Water supply and quality • 89% of U.S. electricity production uses water for steam or cooling • Represents 39% of U.S. water withdrawals • (agriculture ~ 41%; domestic ~ 12%)
Overview of MARKAL: Output Illustrative results Modeling U.S. energy system scenarios with MARKAL Solar Outputs Technology pathway Fuel use Criteria air pollutant emissions Greenhouse gas (GHG) emissions Short-lived climate forcer (SLCF) emissions and radiative impact Wind Scenario assumptions Population growth Economy Climate change Technology development Behavior Policies Hydro MARKAL energy system model and U.S. EPA MARKAL database Nuclear Natural gas Coal
Overview of MARKAL: Output Illustrative results Modeling U.S. energy system scenarios with MARKAL Regional output Electricity production by technology R1 New England Outputs Technology pathway Fuel use Criteria air pollutant emissions Greenhouse gas (GHG) emissions Short-lived climate forcer (SLCF) emissions and radiative impact Scenario assumptions Population growth Economy Climate change Technology development Behavior Policies R4 West North Central R9 Pacific R3 East North Central MARKAL energy system model and U.S. EPA MARKAL database R2 Middle Atlantic R8 Mountain R6 East South Central R5 South Atlantic R7 West South Central
Overview of MARKAL: Output Illustrative results Modeling U.S. energy system scenarios with MARKAL Outputs Technology pathway Fuel use Criteria air pollutant emissions Greenhouse gas (GHG) emissions Short-lived climate forcer (SLCF) emissions and radiative impact Scenario assumptions Population growth Economy Climate change Technology development Behavior Policies E85 plugin hybrid Electric Diesel MARKAL energy system model and U.S. EPA MARKAL database E85 Advanced gasoline Conventional gasoline
Overview of MARKAL: Output Illustrative results Modeling U.S. energy system scenarios with MARKAL Outputs Technology pathway Fuel use Criteria air pollutant emissions Greenhouse gas (GHG) emissions Short-lived climate forcer (SLCF) emissions and radiative impact Scenario assumptions Population growth Economy Climate change Technology development Behavior Policies Lighting MARKAL energy system model and U.S. EPA MARKAL database Refrigeration Cooling
Overview of MARKAL: Output Illustrative results Modeling U.S. energy system scenarios with MARKAL Outputs Technology pathway Fuel use Criteria air pollutant emissions Greenhouse gas (GHG) emissions Short-lived climate forcer (SLCF) emissions and radiative impact Electricity Scenario assumptions Population growth Economy Climate change Technology development Behavior Policies Electricity Natural gas Natural gas MARKAL energy system model and U.S. EPA MARKAL database Jet Fuel Biomass Ethanol Electricity Gasoline LPG Natural gas Diesel
Overview of MARKAL: Output Illustrative results Modeling U.S. energy system scenarios with MARKAL Outputs Technology pathway Fuel use Criteria air pollutant emissions Greenhouse gas (GHG) emissions Short-lived climate forcer (SLCF) emissions and radiative impact Scenario assumptions Population growth Economy Climate change Technology development Behavior Policies MARKAL energy system model and U.S. EPA MARKAL database
Overview of MARKAL: Output Illustrative results Modeling U.S. energy system scenarios with MARKAL Outputs Technology pathway Fuel use Criteria air pollutant emissions Greenhouse gas (GHG) emissions Short-lived climate forcer (SLCF) emissions and radiative impact Scenario assumptions Population growth Economy Climate change Technology development Behavior Policies CO2 SO2 N2O CH4 BC OC MARKAL energy system model and U.S. EPA MARKAL database
Overview of MARKAL: Application Use of MARKAL: What is the technology/fuel pathway that meets energy demands and constraints (e.g., emission limits) at least cost? What are the resulting fuel use and emission impacts? How do the least cost pathway, fuel use, and emissions change when scenario assumptions change? - Alternative assumptions about economic growth - Adoption of a new policy Example: Examining the response to a hypothetical CO2 policy resulting in 35% reduction from 2005 levels by 2050
Overview of MARKAL: Application A base scenario Illustrative results Wind Hydro -35% Electric sector Nuclear Industrial Natural gas Coal Transportation NOx SO2 PM10 N2O CH4 BC Renewables Oil Natural gas Coal
Overview of MARKAL: Application A hypothetical CO2 policy scenario Illustrative results Solar Wind Hydro Electric sector Nuclear Industrial Natural gas CCS Coal Transportation NOx SO2 PM10 N2O CH4 BC Renewables Oil Natural gas Coal
Part 2. Generating CMAQ-ready future emissions Methodology described and demonstrated in: Loughlin, D.H., Benjey, W. G., and C.G. Nolte (2011). “ESP v1.0: methodology for exploring emission impacts of future scenarios in the United States.” Geoscientific Model Development, 4, 287-297, doi:10.5194/gmd-4-287-2011.
Generating CMAQ-ready future emissions Region 5 (South Atlantic) NOx emissions by MARKAL source category Heavy duty - gasoline Off highway - diesel Rail Heavy duty - diesel EGU-Coal Illustrative results
Generating CMAQ-ready future emissions • Step 1. Annual emissions are summed for each combination of: • pollutant species • MARKAL emission category • Census Division
Generating CMAQ-ready future emissions • Step 2. A cross-walk is used to link MARKAL emissions categories to aggregated Source Classification Codes (SCCs) The MARKAL emissions are allocated fully to each of the matching aggregated SCCs
Generating CMAQ-ready future emissions Crosswalk linking MARKAL emission categories with SCC codes Notes: “?” is a wildcard that signifies a match with any digit The crosswalk can be made more specific for shorter-term projections by using less aggregation
Generating CMAQ-ready future emissions • Step 3.For each aggregated SCC, multiplicative emission growth factors are calculated by dividing future-year emissions by base-year emissions
Generating CMAQ-ready future emissions • Step 4. Copies of the resulting growth factors are made for each matching combination of: • pollutant • SCC • state within the region The resulting emissions growth factors are placed in a projection packet in a SMOKE growth-and-control file
Generating CMAQ-ready future emissions • Step 5. SMOKE is used to apply the growth factors to the base-year inventory to develop a CMAQ-ready future-year inventory Alternatively, these factors can be used within EPA’s CoST model to develop a projected emissions inventory
Generating CMAQ-ready future emissions Illustrative results Results for a baseline scenario, South Atlantic Census Division Changes in daily NOx emissions Regional growth factors – 2005 to 2055 Changes in daily PM10 emissions
Generating CMAQ-ready future emissions Important considerations: • How do you apply growth factors to a technology that does not exist in the base year? • How do you site new emission sources? We address these issues by interpreting MARKAL-projected changes as long-term trends, not source-specific changes Aggregating by SCC allows us to capture trends by emission category, with the assumptions that (i) all sources in a category will follow the trend of that category, and (ii) new sources in the category will be co-sited with existing sources
Goals: Screening tool for simultaneous analysis of climate change (radiative forcing) and air quality/health effects of GHGs and short-lived pollutant species Rapidly consider tradeoffs between the environmental and climate impacts with mitigation options and costs Framework links economic and atmospheric models: Energy use and production market model of emissions growth and mitigation using MARKAL GEOS-Chem/LIDORT Adjoint model for determining the radiative forcing impacts and air quality effects of spatial emissions of SLCFs What is GLIMPSE? GEOS-Chem Adjoint LIDORT radiative transfer model Integrated with MARKAL for the Purpose of Scenario Exploration Collaborators: Rob Pinder (EPA/ORD/NERL) FarhanAkhtar (EPA/ORD/NERL) DavenHenze (Univ. of Colorado) Dan Loughlin (EPA/ORD/NRMRL)
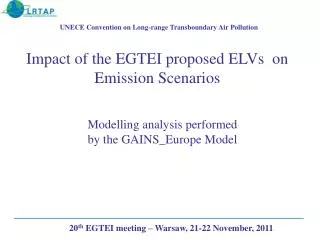
Modifications to MARKAL Added 20- and 100-year global warming potentials for CO2, NOx, SO2, VOC, CO, BC, OC, CH4 and N2O Added regional direct radiative forcing factors for SO2, BC and OC To do: - Add air quality impact factors from CMAQ adjoint - Add health impact factors
Example application of GLIMPSE Illustrative results Baseline scenario CO Regulated pollutants decrease relative to 2010. Others tend to increase.
Example application of GLIMPSE Preliminary results CO2 policy scenario CO Different species react differently to the application of the CO2 policy
Example application of GLIMPSE Global warming potential of non-CO2 emissions Change in annual GWP20 (CO2 policy – baseline) Change in annual GWP100 (CO2 policy – baseline) Net warming CO CO Preliminary results Preliminary results Changes in these emissions have a net warming effect…
Example application of GLIMPSE Global warming potential of all tracked emissions Change in annual GWP100 (CO2 policy – baseline) Change in annual GWP20 (CO2 policy – baseline) CO CO Net cooling Preliminary results Preliminary results … but this effect is dwarfed by the impact of CO2 reductions
Next steps • Use GLIMPSE to identify emission control strategies that simultaneously address criteria pollutants, GHGs and SLCFs goals • Identify synergies in technological pathways that efficiently address all three, accounting for regional differences in resources and impacts
Questions? • For more information… • Dan Loughlin: Loughlin.Dan@epa.gov 919-541-3928 • Also… • CMAS poster on GLIMPSE by FarhanAkhtar et al. • Loughlin, D.H., Benjey, W. G., and C.G. Nolte (2011). “ESP v1.0: methodology for exploring emission impacts of future scenarios in the United States.” Geoscientific Model Development, 4, 287-297, doi:10.5194/gmd-4-287-2011
Recent EPA MARKAL database developments • Expanded pollutant provide energy system coverage for: • CO2, NOx, SO2, PM10, PM2.5, CO, CH4, N2O, VOCs, BC and OC • Reviewing and updating emission factors to be more consistent with recent EPA regulations and modeling • Add factors to track water withdrawals and consumption from electricity production activities • Adding additional biofuels production technologies and improving biomass resource characterization • Revamping characterization of heavy duty transportation technologies (incl. trucks, buses, airplanes, trains, shipping) • Binning existing coal plants by plant age and size, and characterizing emission control options for each bin • Improving characterization of climate change impacts on heating and cooling demands
Recent and ongoing MARKAL applications • Developing air pollutant emission scenarios for the ORD Global Change Air Quality Assessment • Evaluating alternative biofuels production technologies, and examining tradeoffs associated with using biomass for liquid fuels or in electricity production • Examining the performance requirements and potential impacts of breakthrough technologies • Assessing specific technologies: • Hydrogen fuel cell vehicles • Plug-in hybrids • Advanced nuclear power • Coal gasification with CCS • Outdoor wood hydronic heaters • Investigating the role of energy efficiency in meeting greenhouse gas mitigation targets • Examining how technology growth limits impact mitigation pathways and natural gas demands
Abbreviations Models and databases: • AP-42 – U.S. EPA compilation of air pollutant emission factors • CMAQ – Community Multiscale Air Quality modeling system • CoST – Control Strategy Tool model • eGRID – Emissions and Generation Resource Integrated Database • GEOS-Chem – 3-D chemical transport model (CTM), driven by input from the Goddard Earth Observing System (GEOS) • GLIMPSE – GEOS-Chem adjoint LIDORT Integrated with MARKAL for the Purpose of Scenario Exploration • GREET – Greenhouse gases, Regulated Emissions, and Energy use in Transportation model • LIDORT – Linearized Discrete Ordinate Radiative Transfer model • MARKAL – MARKetALlocation energy system model • MOVES – Motor Vehicle Emission Simulator model • SMOKE – Sparse Matrix Operator Kernal Emissions modeling system
Abbreviations, cont’d Pollutants and related metrics: • BC – black carbon • CH4 - methane • CO – carbon monoxide • CO2 – carbon dioxide • GHGs – greenhouse gases • GWP20 – 20-yr global warming potential • GWP100 – 100-yr global warming potential • NOx – nitrogen oxides • N2O – nitrous oxide • OC – organic carbon • PM10 – particulate matter of 10 micrometers or less • PM2.5 – particulate matter of 2.5 micrometers or less • SLCFs – short-lived climate forcers • SO2 – sulfur dioxide • VOC – volatile organic compounds
Abbreviations, cont’d Technologies and fuels: • CCS – carbon capture and sequestration • CHP – combined heat and power technologies • CNG – compressed natural gas • EGU – electricity generating unit • E85 – blend of approximately 85% ethanol, 15% gasoline • HDV – heavy duty vehicles • IGCC – integrated gasification and combined cycle using coal • LDV – light duty vehicles • LPG – liquid petroleum gas • NGA – natural gas • NGCC – natural gas combined cycle • PV – photovoltaic Other: • U.S. EIA – U.S. Energy Information Administration • SCC – Source classification code