Download
1 / 25
250 likes | 364 Vues
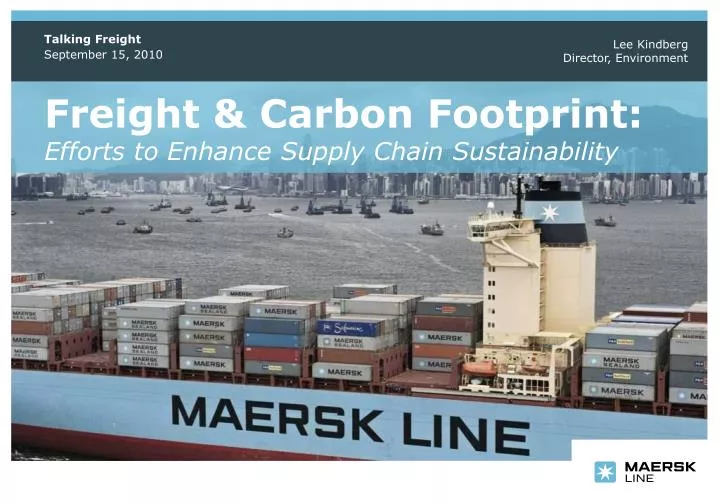
Talking Freight September 15, 2010. Lee Kindberg Director, Environment. Freight & Carbon Footprint: Efforts to Enhance Supply Chain Sustainability. The A.P. Moller–Maersk Group. A.P. Moller-Maersk Group HQ: Copenhagen, Denmark

E N D
Talking Freight September 15, 2010 Lee KindbergDirector, Environment Freight & Carbon Footprint: Efforts to Enhance Supply Chain Sustainability
The A.P. Moller–Maersk Group • A.P. Moller-Maersk GroupHQ: Copenhagen, Denmark • 2009 Revenue: USD $48.5 bin Shipping, Energy, Retail and Banking. • 115,000 employees, 130 countries. North America: US-flagged and international vessels, marine terminals, trucking, warehouse & distributions, and global logistics services. Talking Freight 9/15/2010
Maersk Line – the container shipping arm • Operations • Over 470 container vessels • Move approx 1.8 million containers/yr. • Containers are 20’ or 40’ long. • 90% of all goods transported globally isdone by ship • Maersk Line represents approx. • 4% of worldwide shipping activities • 16% of the container segment • Consumes over 10 M tonnes of heavy fuel oil annually Talking Freight 9/15/2010
CO2 SOx Burning hydrocarbon fuel creates air emissions NOx PM H2O Black carbon Talking Freight 9/15/2010
Vessels routes require several weeks. Multiple vessels are scheduled on each routeto provide regular (weekly) service. Talking Freight 9/15/2010
Hong Kong 18 Apr 2010 04:00 19 Apr 2010 04:00 Los Angeles 30 Apr 2010 18:00 03May 2010 17:00 Yokohama 20 May 2010 01:00 20 May 2010 16:00 Nagoya 21 May 2010 08:00 21May 2010 18:00 Shanghai 23 May 2010 17:00 24 May 2010 07:00 Ningbo 24 May 2010 19:00 25 May 2010 06:00 Xiamen 26 May 2010 13:00 27 May 2010 00:01 Hong Kong 27 May 2010 18:00 28 May 2010 11:00 Yantian 28 May 2010 17:00 29 May 2010 07:00 Tanjung Pelepas 01 Jun 2010 09:00 02 Jun 2010 16:00 Jeddah 11 Jun 2010 23:00 12 Jun 2010 23:00 Suez Canal 15 Jun 2010 01:00 15 Jun 2010 17:00 Barcelona 19 Jun 2010 08:00 20 Jun 2010 08:00 Valencia 21 Jun 2010 02:00 22 Jun 2010 08:00 Algeciras 23 Jun 2010 08:00 24 Jun 2010 14:00 Port Tangier Mediterranee 25 Jun 2010 00:01 26 Jun 2010 02:00 Suez Canal 01 Jul 2010 19:00 02 Jul 2010 17:00 Tanjung Pelepas 17 Jul 2010 02:30 18 Jul 2010 10:30 Vung Tau 20 Jul 2010 08:00 21 Jul 2010 08:00 Yantian 23 Jul 2010 15:00 24 Jul 2010 22:00 Hong Kong 25 Jul 2010 04:00 26 Jul 2010 04:00 Los Angeles 08 Aug 2010 18:00 12 Aug 2010 03:00 Vessel schedule:Georg Maersk on TP-6 14 week round trip Talking Freight 9/15/2010
Transportation does have a significant impact on the environment, but… We are actually doing something about it. Talking Freight 9/15/2010
Vessels are becoming more energy efficient, so are reducing emissions • Due to • Technologies • Operations • Speeds • Vessel size • Reduced over two million tonnes CO2 plus other emissions • Reduction target for 2020 is 25% below 2007 levels Talking Freight 9/15/2010
Maersk Container Vessels -- NOx Emissions g NOx / TEU x km • Decrease in NOx are largely due to reduced fuel consumption • Large and increasing number of vessels built after 2000, so certified to IMO NOx standards Talking Freight 9/15/2010
Fuel switching provides immediate air quality improvement. Vessels change fuels: From Bunker avg. 2.7% sulfur To Distillate avg. 0.12% sulfur Emissions reduction: SOx: 95% PM: 86% NOx: 6 to 12% Locations: California – from 24nm (1.5/0.5% required since 7/2009) WA & BC – at dock Houston – demo 11/09, all Aug. 2010 Mærsk Mc-Kinney Møller stands on the dock at Pier 400 in Los Angeles with the Sine Maersk at berth behind him. The vessel was the first to perform a fuel switch as part of a Maersk Line pilot environmental initiative in California. -- March 31, 2006 Talking Freight 9/15/2010
Speed/Bunkercurve example figures indicative only • Bunker tons 300.0 260 mt @ 24 knot 250.0 60 mts 200.0 200 mt @ 22 knot 40 mts 160 mt @ 20 knot 150.0 100.0 2kn 2kn 50.0 • Speed, knots 0.0 0.00 5.00 10.00 15.00 20.00 25.00 30.00 Operational decisions also have a huge impact:Fuel use and costs increase exponentially at higher speeds • The speed / fuel use curve is exponential above ~14 kts. • Speeding up uses more fuel than is saved by slowing down • Lowest constant speed is best Talking Freight 9/15/2010
Typical 2007 schedule: 12 vessels Fuel consumption: 12,000 MT New economical speed 13 vessels Fuel consumption: 10,000 MT Redesigning routes to reduce speed has great impact 31,000 MT CO2 19 Knots 37,000 MT CO2 20.5 Knots • 12 × • 13 × Barcelona Hong Kong Long Beach (CA) Long Beach (CA) Barcelona Hong Kong • 16% Savings on fuel reduces costs and emissions of CO2 and criteria pollutants Talking Freight 9/15/2010
”Super Slow Steaming” Initiative • Study started in 2007, covered 110 different vessels • Maersk collaborated with engine manufacturers • Results of tests: • Manufacturers have changed recommendations • OK down to 10% engine load (half speed) • Previous recommendation was 40 – 60% • Operational results: • More flexible voyage & schedule planning • Increased schedule reliability • 10 – 30% fuel savings and reduced CO2 • Significant cost savings • 2009 Sustainable Shipping Operator of The Year Talking Freight 9/15/2010
Traditionally, vessels are optimized for high speed Lower economical speed allows for de-rating of the main engine Maximum engine power is restricted Significantly lower fuel consumption at medium power Adjusting main engines to economical speed Talking Freight 9/15/2010
Technical innovation is essential for sustainability Other Initiatives • Alternative fuel tests • New propulsion technologies • ISO 14001 certified • Crew awareness and engagement • Maintenance of hull and propeller • Voyage Efficiency System (VES) • SOx scrubber studies • Antifouling hull paint • QUEST: Low energy chilled containers • Modified bulbous bow • Micro bubbles • Ballast water optimization and treatment systems • Propeller, hull & trim optimization • Waste heat recovery system • Slow steaming and super-slow steaming Talking Freight 9/15/2010 Sales Slide no. 15
3700 g CO2 0 Km 20 Km 10x more Ocean shipping is the most energy-efficient mode of transportation Transport 1 pair of shoes from China to North Europe 372 gCO2 North Europe China Shipping emits <4% of the world’s CO2 emissions while transporting 90% of the worlds goods Talking Freight 9/15/2010
Air > 1,500 km(Boeing 747-400) 5,582 Truck(Global Average) 472 205 Rail diesel Rail electric(Global average) 176 Ocean(Avg. ML-owned vessels) 84 0 1,000 2,000 3,000 4,000 5,000 6,000 grams of CO2 emitted per (TEU.km) CO2 Emissions by Mode of Transportation Ocean shipping has the lowest environmental impact for long distance transportation. Talking Freight 9/15/2010
Factors determining supply chain CO2 footprint: • Mode of transportation • Energy efficiency • Routing available • Distance traveled by each mode • Cargo / container weight and volume • How is the footprint calculated and reported? • WRI distance-based protocol • Carbon analysis • Generic logistics and carbon accounting software • Carrier-specific tools (CarbonCheck™, Carbon Dashboard™) • Clean Cargo Working Group has added definition and collects data for vessels (other groups focus on other modes) Talking Freight 9/15/2010
Working with the industry and customers to reduce impactshttp://www.bsr.org/consulting/working-groups/clean-cargo.cfm • Clean Cargo Working Group is a business-to-business forum with the goal “to promote more sustainable product transportation” • Members include: • Shippers:American Eagle Outfitters, Chiquita, Coca-Cola, IKEA, Johnson & Johnson, John Wiley & Sons, NIKE, Nordstrom, Phillips-Van Heusen, Polo Ralph Lauren, Starbucks, Wal-Mart • Ocean liner companies:APL, CMA CGM, COSCO, Hamburg Sud, Hanjin, Hapag Lloyd, Hyundai, K Line, Li & Fung, Maersk Line, NYK Line, OOCL, Safmarine, Shell Marine, UPS, Yang Ming • Annual evaluation of member lines’ environmental performance • Intermodal calculator Talking Freight 9/15/2010
Clean Cargo Working Group Environmental Performance Scorecard Talking Freight 9/15/2010
1300 kg of CO2 980 kg CO2 Reducing air emissions by routing • Istanbul to Belgium • Compare CO2 emitted per container • all truck • sea and truck transportation 20 km Talking Freight 9/15/2010
Case study: Nike Visibility on supply chain carbon emissions to help accomplish 30% reduction target for 2020
Greener can also be cheaper • Case studies at www.damco.com • CarbonCheck projects with Boots, a leading international chain of pharmacy and health and beauty stores. • Since 2004, focus on these analyses have enabled Boots to • reduce CO2 emissions by 29% and • reduce logistics costs by 21% in their inbound supply chain from Asia to their distribution centre in England. • ”It goes to show that if you review and optimize your supply chain end-to-end from a green perspective, great savings can be made.” • -- Erling Johns NielsenDamco Supply Chain Development Team Talking Freight 9/15/2010
What we’ve learned • Use a consistent calculator approach • Best if agreed-upon by whole industry • Clean Cargo Working Group (BSR) • Transportation footprints can and have been reduced • Remember: It’s the total lifecycle footprint that matters • Transportation is often a small part of the total. • You have to do the full analysis to see the big picture • Focus on improvements and incorporating CO2 into business decisions • Opportunity: reduce both CO2 emissions and costs Talking Freight 9/15/2010
Thank you Contact Information: Lee Kindberg Director, Environment 704-571-2693 NAMENVIRO@maersk.com Talking Freight 9/15/2010