Download
1 / 27
270 likes | 395 Vues
Turbulence in Alcator C-Mod and W7-AS plasmas during confinement transitions.

E N D
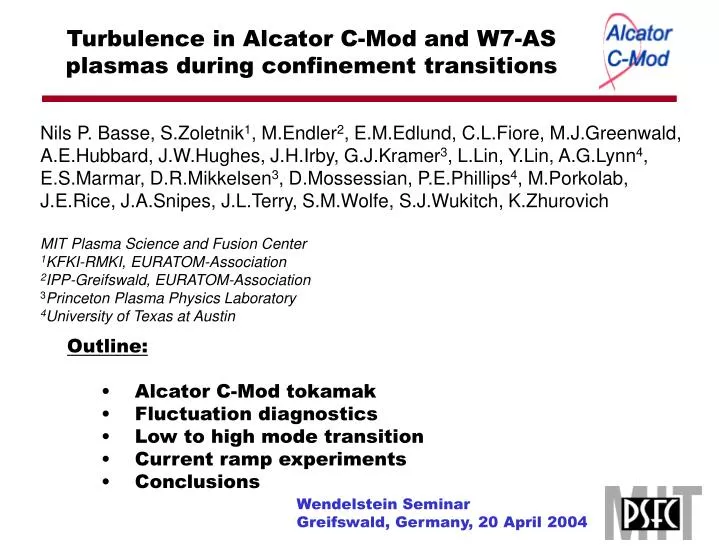
Turbulence in Alcator C-Mod and W7-AS plasmas during confinement transitions Nils P. Basse, S.Zoletnik1, M.Endler2, E.M.Edlund, C.L.Fiore, M.J.Greenwald, A.E.Hubbard, J.W.Hughes, J.H.Irby, G.J.Kramer3, L.Lin, Y.Lin, A.G.Lynn4, E.S.Marmar, D.R.Mikkelsen3, D.Mossessian, P.E.Phillips4, M.Porkolab, J.E.Rice, J.A.Snipes, J.L.Terry, S.M.Wolfe, S.J.Wukitch, K.Zhurovich MIT Plasma Science and Fusion Center 1KFKI-RMKI, EURATOM-Association 2IPP-Greifswald, EURATOM-Association 3Princeton Plasma Physics Laboratory 4University of Texas at Austin • Outline: • Alcator C-Mod tokamak • Fluctuation diagnostics • Low to high mode transition • Current ramp experiments • Conclusions Wendelstein Seminar Greifswald, Germany, 20 April 2004
Alcator C-Mod tokamak Alcator C-Mod is a divertor tokamak with high magnetic field capability (Bt 8 T) in which quite high plasma currents (Ip 1.7 MA) are possible in a compact geometry (R = 0.67 m, a = 0.22 m). Strong shaping options. Plasma densities well above 11021 m-3 have been obtained, but more typically the average density is in the range (1-5)1020 m-3. Auxiliary heating: Up to 6 MW ICRF (3 antennas, frequency between 50 and 80 MHz). Plasma facing components are made of Molybdenum.
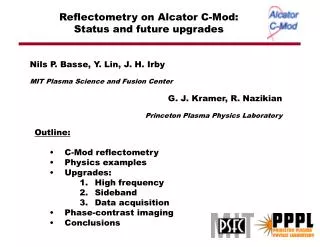
Fluctuation diagnostics • Four different diagnostics are used for turbulence studies at the confinement transitions: • Phase-contrast imaging (PCI) • Reflectometry • Mirnov coil • D-alpha light • PCI: 32 vertical chords, spacing 4 mm, width of same order. Sampled 16 bit at 10 MHz, 25 W industrial CO2 laser. Line integrated measurements. Sensitive to wavenumbers from 0.5 to 10 cm-1. • Reflectometry: 7 fixed frequency channels operating in O-mode. Sampled 12 bit at 1 MHz. We show results from the 132 GHz channel, reflecting off a density of 2.21020 m-3.
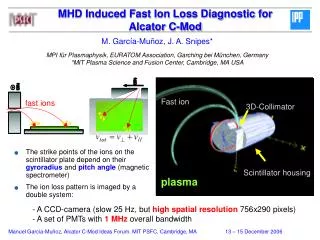
Low to high mode transitionshot 1040310012 L-H transition
W7-AS spectrogramwavenumber = 14 cm-1 Negative (positive) frequencies are due to fluctuations travelling outward (inward) parallel to the major radius.
W7-AS autopower spectrawavenumber = 14 cm-1 Dithering Steady-state Solid lines are L-mode, dotted lines are H-mode. Negative (positive) frequencies are due to fluctuations travelling outward (inward) parallel to the major radius.
PCI frequency-wavenumber spectra L-mode EDA H-mode By performing 2D Fourier transforms on the PCI data from all 32 channels, we arrive at frequency-wavenumber spectra. The largest increase in frequency coverage from L- to H-mode is at large wavenumbers. Negative (positive) wavenumbers are due to fluctuations travelling outward (inward) parallel to the major radius.
PCI autopower-wavenumber spectra Integrating fluctuations over all frequencies we can plot wavenumber spectra for L- and H-mode. The L-mode spectrum peaks around 3-4 cm-1 and only exceeds the H-mode autopower for small wavenumbers. The H-mode spectrum peaks at the QC-mode wavenumber. There are indications that a second peak exists at larger wavenumbers.
W7-AS autopower-wavenumber spectra Solid lines are power-law fits to the three smallest and five largest wavenumbers, dashed lines are fits to exponential functions. The vertical lines indicate the transition wavenumber for the power-law fits. The power-law fit grouping of points used is the only one where convergence is obtained. Triangles are volume 1, squares volume 2.
Correlationsbetween PCI and Mirnov coil/D-alpha Mirnov coil D-alpha Cross correlation between rms Mirnov coil/D-alpha fluctuations and PCI band autopowers. Band autopower resolution 50 kHz, time resolution 0.5 ms. Positive (negative) time lag: PCI fluctuations occur before (after) the Mirnov coil/D-alpha fluctuations.
Correlationsbetween PCI and ECE GPC2 (Grating PolyChromator 2) FRCECE (Fusion Research Center ECE) Cross correlation between rms electron cyclotron emission (ECE) temperatures and PCI band autopower from 20 kHz to 2 MHz. The time resolution is 0.5 ms. Positive (negative) time lag: PCI fluctuations occur before (after) the ECE temperature changes. GPC2: 14 channels, time res. 0.25 ms. FRCECE: 15 channels, time res. 0.005 ms.
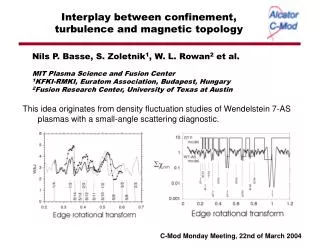
Current ramp experiments • W7-AS model has been developed, where the electron heat conductivity is described by three contributions: • Neoclassical transport • Turbulent transport • Transport close to low-order rational surfaces • Discharges were made in W7-AS where slow, reproducible confinement transitions were created by driving a small plasma current. Large correlated changes were observed in density, magnetic and H-alpha fluctuations. • [Figures adapted from R.Brakel and W7-AS Team, Nucl. Fusion 42 (2002) 903-912.]
W7-AS localized density fluctuations Fluctuations can be localized towards the bottom or the top of the plasma by calculating the crosspower spectrum between the two measurement volumes. Dotted lines are good confinement, solid lines are bad confinement.
C-Mod current ramp experiments We wanted to investigate whether transport barriers close to low-order rational surfaces exist in tokamaks. If they do, controlled confinement transitions created by slow ramping of the plasma current would provide an additional tool for turbulence studies in C-Mod akin to the research we made in W7-AS. A local, rather than global, effect would be expected in a tokamak because the magnetic shear is much larger than in a stellarator. Simple estimates based on W7-AS discharges showed that we would predict a region spanning 1.5 cm in minor radius to be affected (about 0.1a). L-mode, inner wall limited, low elongation, low triangularity shots were developed over the course of two run days to probe this topic.
Correlationsbetween PCI and ECE Good confinement Bad confinement Cross correlation between rms electron cyclotron emission (ECE) temperatures and PCI band autopower from 20 kHz to 2 MHz. The time resolution is 0.5 ms. Positive (negative) time lag: PCI fluctuations occur before (after) the ECE temperature changes. GPC2: 14 channels, time res. 0.25 ms.
Correlationsbetween reflectometry and PCI Good confinement Bad confinement Cross correlation between rms reflectometry fluctuations and PCI band autopower from 20 kHz to 2 MHz. The time resolution is 0.5 ms. Positive (negative) time lag: PCI fluctuations occur before (after) the reflectometry fluctuations.
Conclusions • We have in this talk presented an analysis of turbulence at the L-H transition and in response to slow current ramps in Alcator C-Mod and W7-AS. • The PCI diagnostic has been upgraded from 12 to 32 channels and fast digitization has been implemented. • The reflectometer has been augmented by 2 high frequency (132 and 140 GHz) channels. • L-H transition (C-Mod): • PCI measurements display the appearance of high frequency, large wavenumber fluctuations at the transition. • The turbulence amplitude increases for all except very small wavenumbers. • Strong correlations exist between PCI and Mirnov coil/D-alpha/electron temperature signals at the transition. • Current ramp experiments (C-Mod): • No observable response in autopower spectra. • Slight shift of the wavenumber spectrum towards smaller values. • Changes in correlations between PCI and electron temperature signals and between reflectometry and PCI fluctuations.