Download
1 / 1
10 likes | 138 Vues
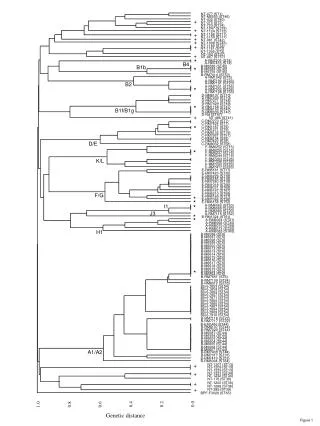
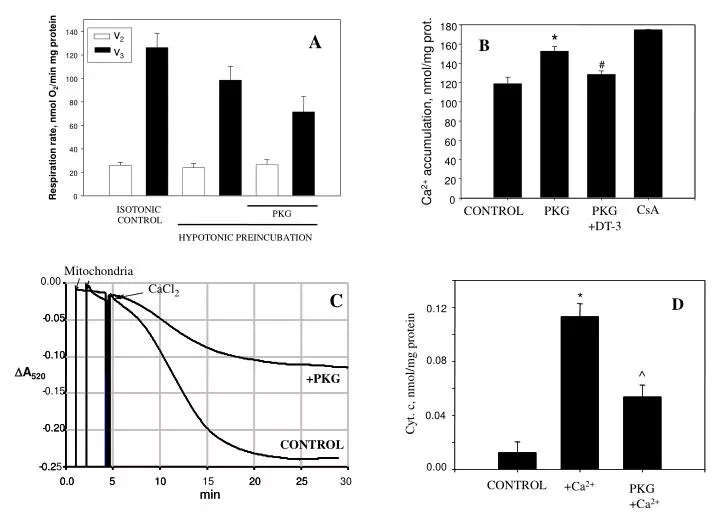
180. *. B. 160. v 2. 140. A. #. 140. v 3. 120. 120. Mitochondria. 0.00. 100. CaCl 2. 100. Ca 2+ accumulation, nmol/mg prot. C. 80. 80. Respiration rate, nmol O 2 /min mg protein. -. -. 0.05. 0.05. 60. 60. 40. -. -. 0.10. 0.10. 40. 20. +PKG. 20. 0. -. -.

E N D
180 * B 160 v2 140 A # 140 v3 120 120 Mitochondria 0.00 100 CaCl2 100 Ca2+ accumulation, nmol/mg prot. C 80 80 Respiration rate, nmol O2/min mg protein - - 0.05 0.05 60 60 40 - - 0.10 0.10 40 20 +PKG 20 0 - - 0.15 CsA CONTROL PKG PKG +DT-3 0 ISOTONIC PKG CONTROL - - 0.20 0.20 HYPOTONIC PREINCUBATION CONTROL - - 0.2 0.25 * 0.0 5 10 20 25 0.0 5 10 15 20 25 30 D min min 0.12 0.08 Cyt. c, nmol/mg protein ^ DA520 0.04 0.00 CONTROL +Ca2+ PKG +Ca2+