Download
1 / 46
460 likes | 569 Vues
Measuring q 13 with Reactors Stuart Freedman University of California at Berkeley SLAC Seminar September 29, 2003. q 13. How to Weigh Dumbo’s Magic Feather. I am going to argue that --

E N D
Measuring q13 with Reactors Stuart Freedman University of California at Berkeley SLAC Seminar September 29, 2003
q13 How to Weigh Dumbo’s Magic Feather I am going to argue that -- the fastest and cheapest way to determine the value of Sin22q13 is to measure two big things and subtract the results. - =
UMNSP Matrix 12 ~ 30° tan2 13 < 0.03 at 90% CL 23 ~ 45° Mass Hierarchy
What do we know and how do we know it Slide Courtesy of B. Kayser
L. Wofenstein B. Kayser S. Bilenky S. Glashow A Smirnov Testimonials
absorber decay pipe detector p target horn + + + e e e Measuring13 Accelerator Experiments • appearance experiment • measurement of e and e yields 13,CP • baseline O(100 -1000 km), matter effects present Reactor Neutrino Oscillation Experiment • disappearance experiment • but: observation of oscillation signature with 2 or multiple detectors • look for deviations from 1/r2 • baseline O(1 km), no matter effects
Figuring out CP for leptons Minakata and Nunokawa, hep-ph/0108085
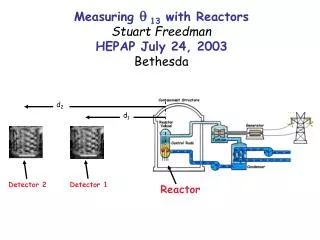
d2 d1 Detector 2 Detector 1 Reactor Experimental Design
First Direct Detection of the Neutrino Scintillator ne e+ n 2.2MeV n m Reines and Cowan 1956
235U fission Neutrino Spectra from Principal Reactor Isotopes
20 m KamLAND 4 m Chooz 1m Long Baseline Reactor Neutrino Experiments Poltergeist
Inverse Beta Decay Signal from KamLAND from 12C(n, g ) tcap = 188 +/- 23 msec
q13 at a US nuclear power plant? Site Requirements • powerful reactors • overburden • controlled access
scintillator e detectors e + p e+ + n coincidence signal prompt e+ annihilation delayed n capture (in s) e,, ~ 1.5-2.5km e < 1 km • • No degeneracies • • No matter effects • • Practically no correlations • E = Ee + mn-mp • Eprompt = Ekin + 2me • disappearance experiment • look for rate deviations from 1/r2 and spectral distortions • observation of oscillation signature with 2 or multiple detectors • baseline O(1 km), no matter effects
Detector Event Rate/Year ~250,000 ~60,000 ~10,000 Statistical error: stat ~ 0.5%for L = 300t-yr Statistical Precision Dominated by the Far Detector
Diablo Canyon Variable Baseline 2 or 3 detectors in 1-1.5 km tunnel
IIIb IIIa Ge Geology II I • Issues • folding may have damaged rock matrix • - steep topography causes landslide risk • tunnel orientation and key block failure • seismic hazards and hydrology
Detector Concept muon veto acrylic vessel 5 m liquid scintillator buffer oil 1.6 m passive shield Variable baseline to control systematics and demonstrate oscillations (if |13| > 0)
6 10 5 m Movable Detectors 1-2 km ~12 m • Modular, movable detectors • Volume scalable • Vfiducial ~ 50-100 t/detector
Kashiwazaki:13 Experiment in Japan - 7 nuclear reactors, World’s largest power station far near near Kashiwazaki-Kariwa Nuclear Power Station
Kashiwazaki:Proposal for Reactor 13 Experiment in Japan far near near 70 m 70 m 200-300 m 6 m shaft hole, 200-300 m depth
~20000 ev/year ~1.5 x 10⁶ ev/year Kr2Det: Reactor 13 Experiment at Krasnoyarsk Features - underground reactor - existing infrastructure Detector locations constrained by existing infrastructure Reactor Ref: Marteyamov et al, hep-ex/0211070
Systematic Uncertainties % Total LS mass 2.1 Fiducial mass ratio 4.1 Energy threshold 2.1 Tagging efficiency 2.1 Live time 0.07 Reactor power 2.0 Fuel composition 1.0 Time lag 0.28 e spectra 2.5 Cross section 0.2 Total uncertainty 6.4 % E > 2.6 MeV
. flux < 0.2% rel eff ≤ 1% target ~ 0.3% acc < 0.5% nbkgd< 1% Systematics Best experiment to date: CHOOZ Ref: Apollonio et al., hep-ex/0301017 Reactor Flux • near/far ratio, choice of detector location Detector Efficiency • built near and far detector of same design • calibrate relative detector efficiency variable baseline may be necessary Target Volume & • well defined fiducial volume Backgrounds • external active and passive shielding for correlated backgrounds Total syst ~ 1-1.5%
Optimization at LBNL ‘near-far’ L1 = 1 km L2 = 3 km ‘far-far’ L1=6 km L2=7.8 km MC Studies Normalization: 10k events at 10km Oscillation Parameters: sin2213 = 0.14 m2= 2.5 x 10⁻³ eV2
Sensitivity to sin2213at 90% CL cal relative near/far energy calibration norm relative near/far flux normalization Reactor I 12 t, 7 GWth, 5 yrs Reactor II 250 t, 7 GWth, 5 yrs Chooz 5 t, 8.4 GWth, 1.5 yrs fit to spectral shape Ref: Huber et al., hep-ph/0303232 Reactor-I: limit depends on norm (flux normalization) Reactor-II: limit essentially independent of norm statistical error only
Ref: Huber et al., hep-ph/0303232 statistics Statistics Systematics Correlations Degeneracies
Expected Constraints on13 Upper limits correspond to 90% C.L.