Download
1 / 24
250 likes | 437 Vues
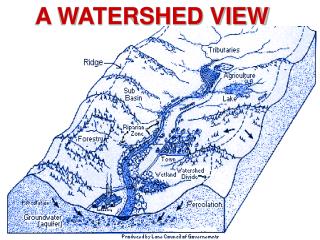
超大集水區最大潛在洪水之暴雨中心位置 STORM CENTERING TECHNIQUE FOR LARGE WATERSHED MODELING By James C.Y. Guo (郭純園 ) , PhD, P.E. and Professor Civil Engineering, University of Colorado at Denver, Colorado, USA . System Concept of Watershed Model. Rainfall= frequency + depth + distribution + duration

E N D
超大集水區最大潛在洪水之暴雨中心位置 STORM CENTERING TECHNIQUE FOR LARGE WATERSHED MODELING By James C.Y. Guo(郭純園), PhD, P.E. and Professor Civil Engineering, University of Colorado at Denver, Colorado, USA
System Concept of Watershed Model Rainfall= frequency + depth + distribution + duration Watershed = area + slope + length + soil loss +Imp% Runoff= unit graph* rainfall excess
Model to Convert Rain to Runoff • Physical Model On-stream measurement vs Laboratory test • Probabilistic Model Time-dependent vs Time-independent Homogeneous vs non-homogeneous data • Empirical Model Regression analysis at stream gage Regional analysis for hydrologic zone • Prediction (Numerical) Model Overland flow + Channel flow routing • Forecasting (real-time) Model Threshold-depth and Alternative Studies
Q3. Unit Graph Approach • Snyder UH method (Snyder 1938) was derived to ONLY predict hydrographs based on the watershed natural drainage characteristics using empirical formulas. Major parameters include A, S, L, and Lc. • SCS UH method (1964) was calibrated using large rural watersheds. SCS empirical UH formulas can work with 6- and 24-hr rainfall distributions, curve number loss functions, and SCS flow time through the watershed. In the 1980s, SCS 55 was an effort to add urbanization impact into the SCS procedure. • CUHP method (Colorado Urban Hydrograph Procedure 1982) was derived for Denver metro areas. The major improvement to the UH method is to add “watershed development condition, i.e. imp %” into the empirical formulas. Horton’s formula is used to estimate the soil loss. CUHP applies an event-based lumped-parameter approach to areas from 5 to 3000 acres. For watersheds larger than 10 sq miles, the 2-hr design rainfall curve can be extended to 6 hours with rainfall depth-area reduction.
Q4. Flood Wave Approach (Wooding 1965) Dynamic wave model (SWMM5 2005) local/convective acceleration, backwater, friction, and gravity Kinematic wave model No significant flow acceleration, no backwater, flow friction equal to gravitation force, and single-valued rating curve
Q5 Kinematic KW Sloping Plane SWMM converts an irregular watershed into sloping planes based on the two KNOWN parameters, Lw and Sw. If not known, conduct a calibration study. If not calibrated, give your best to guess (?!).
Q6. Long Existing Problem --- Lw? In general, the wider the plane width, the higher the peak flow. The recommended plane width= 2x waterway length. The 2330-ac urban area in Toronto was modeled with 45 sub-catchments (Proctor, Redfern, and MacLaren 1976). It was found that the best agreement of peak flow is to set the width to be 1.7 times the collector length, NOT TWICE.
Q7. Level of Discritization • SWMM 4 User Manual presents a sensitivity study on the level of discretization on overland flow planes. • SWMM4 indicates that the detailed overland flow paths increase the storage volume and decrease the peak flow, Therefore, it is necessary to adjust the width of the KW plane. Since there is no guidance, a factor of two has been considered acceptable for all cases.
Q8. Watershed Shape EffectsSWMM Manual (Huber and Dickinson 1988)
Q9 Calibration or Not? Source: Fox Hollow Watershed, Centre County PA, 2006
Stormwater Bmp Approaches • reduction of paved area, • an increase of porous pavement, • filtering runoff by grass buffers, and • infiltration by porous cascading planes. Conventional Layout MDCIA Layout
Q10: Effective Imperviousness % Using conventional area-weighted method, these three drainage systems have the same imperviousness percentage of 50%. As a result, they are expected to produce the same amount of storm runoff. Under stormwater BMP concept, these three drainage systems represent different MDCIA layouts and produce different runoff flows and volumes. We need a method that can tell the difference……….
Answer to Q’s: Level 1: Precision effective digits for numerical computations Level 2: Consistency regression and regional analyses Level 3: Accuracycalibration for model parameters Ultimate Goal Representation of “LOCAL” hydrologic processes
A. Storm Runoff vs Watershed Area The statement: “the larger watershed, the more runoff” was derived from the simplified relationship between watershed area, A, and peak runoff, Q. For instance, many regression methods such as the Rational method and unitgraph methods such as CUHP and UDSWMM support the above statement. Q = a AbSc So, Q is proportional to A.The key assumption of the above statement is that the storm covers the entire watershed area, Or the entire watershed has become tributary to the peak runoff.What if the watershed is 500 or larger square miles?
(B) Storm Centering on Large WatershedAnswer the two key questions(1) where the storm center is? (2) what is the area-average rainfall?
(B.2) Storm CenteringHow to maximize the flood flow –-- Max (Avg P x Area)
(F) DESIG EXAMPLE At Las Vegas, NV Go-wan Street and Hu-la-pai Circle
Conclusion • Urban Storm Water Planning -- Methodology • Urban Storm Water Design -- Criteria • Urban Land Development -- Regulation • Urban Development Construction -- Inspection • Urban Sustainability -- Maintenance Modeling techniques can be off the base line, but the same method must be consistently implemented for the entire region. A urban area can have a sound drainage system if the same design criteria can be consistently applied to the entire region.