Download
1 / 24
240 likes | 439 Vues
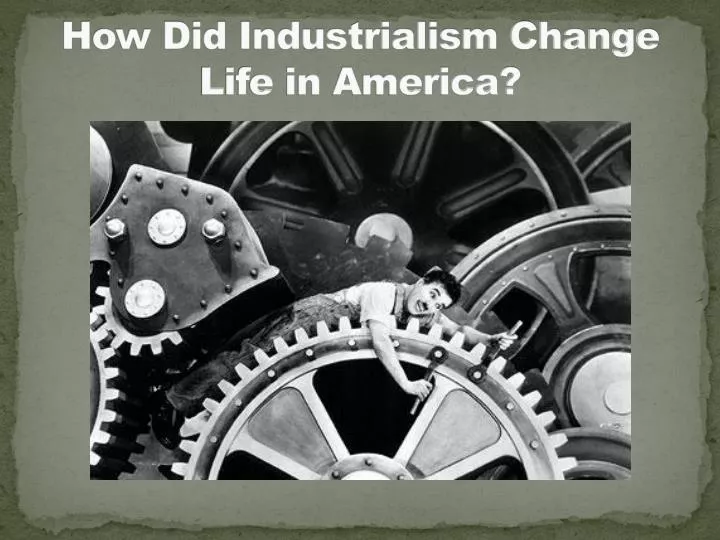
How Did Industrialism Change Life in America?. Analyzing Data. Line graph: Uses simple line to show how approximate numbers change over a period of time Indicator line: The simple line in a line graph.

E N D
Analyzing Data • Line graph: Uses simple line to show how approximate numbers change over a period of time • Indicator line: The simple line in a line graph • Trend: If the indicator line goes up, it shows things have increased. If it goes down, things have decreased. This is called a trend. • Vertical axis: Axis that runs up and down • Horizontal axis: Axis that runs from side to side.
Questions A and B • These are “what” questions • “What” does the graph show? • This is factual information • This can be recorded as bullet-point information (not necessarily in complete sentences)
Question C • This is a “so what” question • This requires you to think about the consequences (results, outcomes) of the facts • This asks you to make generalizations based on the facts • This MUST be in the form of one or two COMPLETE SENTENCES
1.2A • A. Approximately how many miles of telegraph wire were installed in 1896? • B. In which five-year period did the amount of telegraph wire installed increase the most? • C. Notice the train at the base of the telegraph poles. How do you think the expansionism of railroads and the expansion of telegraph services affected one another?
1.2B • A. In 1880, approximately what was the rural population? Urban population? • B. Between the years 1840 and 1920 did the rural or urban population increase more? • C. What does this graph reveal about changing population patterns during these years?
1.2C • A. List the years in which more than 400,000 immigrants came to the United States? • B. In which five-year period did immigration increase the most? Decrease the most? • C. What does this graph reveal about the changing population patterns during these years?
1.2D • A. In what year were the number of workers in agricultural and nonagricultural jobs the closest? • B. List the years in which the number of laborers in agricultural jobs was greater than the number in nonagricultural jobs? • C. Which type of workers are pictured in the photograph? Describe how the line graph reveals their importance to the U.S. economy?
1.2E • A. What is the total number of years represented on the horizontal axis? • B. The indicator line shows two basic trends in farm income. In what period did farm income remain steady? In what period did farm income constantly increase? • C. Look carefully at the picture. In what ways to you think new technology affected farm income after 1895?
1.2F • A. In what years were one million or more tons of steel produced? • B. Approximately how many more tons of steel were produced in 1885 than in 1865? • C. Look carefully at both the photograph and the line graph. How did steel production contribute to the growth of other key industries in this time period?
1.2G • A. What does the horizontal axis show? The vertical axis? • B. Look at the indicator line and describe the trend in miles of railroad track operated. • C. How do you think the expansion of railroads contributed to the rise of industrialism in the United States?
1.2H • A. What does the horizontal axis show? The vertical? • B. In how many periods did the value of exports decline? Name those periods. • C. What was the overall trend in the value of exports between 1850 and 1900? What does the picture suggest were some of the factors that contributed to this trend?
1.2I • A. Approximately how many patents were issued in 1845? In 1880? In 1900? • B. What was the overall trend in patents issued between 1845 and 1900? • C. Why do you think the trend in the number of patents issued was so important to the rise of industrialism?
1.2J • A. Approximately how many kilowatt-hours of electric energy were used in 1902? In 1920? • B. In what year did the amount of electricity used reach 25 billion kilowatt-hours? • C. The first electric power station was installed in 1882 in New York. In this picture of New York, what important uses of electricity do you see? How do you think the use of electric energy changed city life?