Download
1 / 38
380 likes | 456 Vues
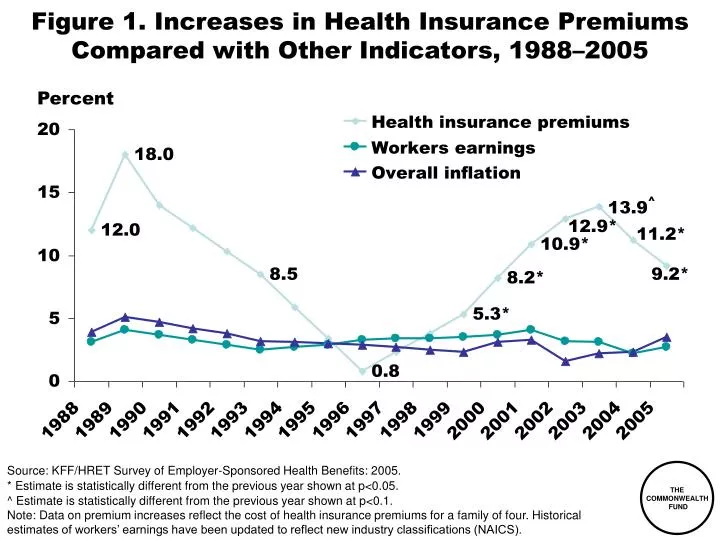
Figure 1. Increases in Health Insurance Premiums Compared with Other Indicators, 1988–2005. Percent. Source: KFF/HRET Survey of Employer-Sponsored Health Benefits: 2005. * Estimate is statistically different from the previous year shown at p<0.05.

E N D
Figure 1. Increases in Health Insurance Premiums Compared with Other Indicators, 1988–2005 Percent Source: KFF/HRET Survey of Employer-Sponsored Health Benefits: 2005. * Estimate is statistically different from the previous year shown at p<0.05. ^ Estimate is statistically different from the previous year shown at p<0.1. Note: Data on premium increases reflect the cost of health insurance premiums for a family of four. Historical estimates of workers’ earnings have been updated to reflect new industry classifications (NAICS).
Figure 2. Deductibles Rise Sharply,Especially in Small Firms, Over 2000–2005* PPO in-network and out-of-network deductibles In-network In-network Out-of-network Out-of-network Small firms(3–199 employees) Large firms(200+ employees) * Out-of-network deductibles are for 2000 and 2004. Source: J. Gabel and J. Pickreign, Risky Business: When Mom and Pop Buy Health Insurance for Their Employees (Commonwealth Fund, Apr. 2004); KFF/HRET Employer Health Benefits 2005 Annual Survey.
Figure 3. Percent of Firms Offering Health Benefits Declined Over 2000–2005 Percent of firms offering health benefits Source: KFF/HRET Employer Health Benefits 2005 Annual Survey.
Figure 4. 47 Million Uninsured in 2005; Increasing Steadily Since 2000 Number of uninsured, in millions 2013 Projected *1999–2003 estimates reflect the results of follow-up verification questionsand implementation of Census 2000-based population controls. Note: Projected estimates for 2006–2013 are for nonelderly uninsured based onT. Gilmer and R. Kronick, “It’s the Premiums, Stupid: Projections of the UninsuredThrough 2013,” Health Affairs Web Exclusive, Apr. 5, 2005. Source: U.S. Census Bureau, March CPS Surveys 1988 to 2005.
Figure 5. Americans Spend More Out-of-Pocket on Health Care Expenses National health expenditures per capita (US$) United States Canada Germany Australia Netherlands France OECD Median Japana New Zealand Out-of-pocket health care spending per capita (US$) a 2002 Note: Adjusted for differences in the cost of living, 2003. Source: B.K. Frogner and G.F. Anderson, Multinational Comparisons of Health Systems Data, 2005, The Commonwealth Fund, April 2006.
Figure 6. Americans Are Spending More Out-of-Pocket for Health Care Dollars spent per capita (in 2004 dollars) $788 $774 $667 $583 $577 Source: C. Smith et al., “National Health Spending in 2004: Recent Slowdown Led by Prescription Drug Spending,” Health Affairs 25, no. 1 (Jan./Feb. 2006); Centers for Medicare and Medicaid Services, National Health Expenditures Data; http://www.cms.hhs.gov/NationalHealthExpendData/downloads/tables.pdf
Figure 7. Adults with Individual CoverageAre More Likely to Spend $5,000 or More Annuallyon Personal Out-of-Pocket Expenses Percent of adults ages 19–64 insured all year with private insurance 41 31 30 ESI = employer-sponsored insurance. Source: S.R. Collins, J.L. Kriss et al., Squeezed: Why Rising Exposure to Health Care Costs Threatens the Health and Financial Well-Being of American Families, The Commonwealth Fund, Sept. 2006.
Figure 8. Adults with Higher DeductiblesAre More Likely to Spend $1,000 or Moreon Personal Out-of-Pocket Expenses Percent of adults ages 19–64 insured all year with private insurance 55 40 31 27 Annual deductible Source: S.R. Collins, J.L. Kriss et al., Squeezed: Why Rising Exposure to Health Care Costs Threatens the Health and Financial Well-Being of American Families, The Commonwealth Fund, Sept. 2006.
Figure 9. One-Quarter of Adults Spent 10 Percentor More of Their Household Income Annually on Family Out-of-Pocket Expenses and Premiums Percent of adults ages 19–64 insured all year with private insurance ESI = employer-sponsored insurance. Source: S.R. Collins, J.L. Kriss et al., Squeezed: Why Rising Exposure to Health Care Costs Threatens the Health and Financial Well-Being of American Families, The Commonwealth Fund, Sept. 2006.
Figure 10. Adults with Higher Deductibles Are More Likely to Spend a Greater Share of Household Income on Family Out-of-Pocket Expenses and Premiums Percent of adults ages 19–64 insured all year with private insurance Annual deductible Source: S.R. Collins, J.L. Kriss et al., Squeezed: Why Rising Exposure to Health Care Costs Threatens the Health and Financial Well-Being of American Families, The Commonwealth Fund, Sept. 2006.
Figure 11. Low-Income Households at Most Riskfor Spending Greater Shares of Income onFamily Out-of-Pocket Expenses and Premiums Percent of adults ages 19–64 insured all year with private insurance Annual income Source: S.R. Collins, J.L. Kriss et al., Squeezed: Why Rising Exposure to Health Care Costs Threatens the Health and Financial Well-Being of American Families, The Commonwealth Fund, Sept. 2006.
Figure 12. Adults with High DeductiblesAre More Likely to Avoid Needed Health Care Because of Cost Percent of adults ages 19–64 insured all year with private insurance Source: S.R. Collins, J.L. Kriss et al., Squeezed: Why Rising Exposure to Health Care Costs Threatens the Health and Financial Well-Being of American Families, The Commonwealth Fund, Sept. 2006.
Figure 13. Cost-Sharing Reduces Use of Both Essential and Less Essential Drugs and Increases Risk of Adverse Events Percent reduction in drugs per day Percent increase in incidence per 10,000 Source: R. Tamblyn et al., “Adverse Events Associated with Prescription Drug Cost-SharingAmong Poor and Elderly Persons,” JAMA, Jan. 24/31, 2001 285(4):421–29.
Figure 14. Adults with High DeductiblesHave Problems Paying Medical Billsor Are Paying Off Medical Debt Percent of adults ages 19–64 insured all year with private insurance * Includes only those individuals who had a bill sentto a collection agency when they were unable to pay it. Source: S.R. Collins, J.L. Kriss et al., Squeezed: Why Rising Exposure to Health Care Costs Threatens the Health and Financial Well-Being of American Families, The Commonwealth Fund, Sept. 2006.
Figure 15. Increased Health Care Costs Have Reduced Savings Has increased spending on health care expenses in the past year caused you to do any of the following? Among those with health insurance coverage who had increases in health care costs in the last year (n=731) (percentage saying yes) Decrease your contributions to other savings Have difficulty paying for other bills Use up all or most of your savings Decrease your contributions to a retirement plan, such as a 401(k), 403(b) or 457 plan, or an IRA Have difficulty paying for basic necessities, like food, heat, and housing Borrow money Source: EBRI Health Confidence Survey, 2005.
Figure 16. Few Insured People Are Currently Covered by High-Deductible Health Plans (HDHP) or Consumer-Directed Health Plans (CDHP) with a Savings Account Note: Comprehensive = plan w/ no deductible or <$1000 (ind), <$2000 (fam);HDHP = plan w/ deductible $1000+ (ind), $2000+ (fam), no account;CDHP = plan w/ deductible $1000+ (ind), $2000+ (fam), w/ account. Source: P. Fronstin, S.R. Collins, Early Experience with High-Deductible and Consumer-DrivenHealth Plans: Findings From the EBRI/Commonwealth Fund Consumerism in Health Care Survey, EBRI Issue Brief, Dec. 2005.
Figure 17. FEHBP HDHP/HSA Plans Enroll7,500 Out of 9 Million Covered Lives Percent Note: As of March 2005. Source: Government Accountability Office, Federal Employees Health Benefits Program First-Year Experience with High-Deductible Health Plans and Health Savings Accounts, Washington, DC: GAO, Jan. 2006; OPM, http://www.opm.gov/insure/handbook/FEHBhandbook.pdf
Figure 18. Enrollees Who Chose HDHPs fromthe Federal Employees Health Benefits Program Are More Likely to Earn Higher Incomes Percent of FEHBP enrollees with incomes > $75,000 Source: Government Accountability Office, Federal Employees Health Benefits Program First-Year Experience with High-Deductible Health Plans and Health Savings Accounts, Washington, DC: GAO, Jan. 2006.
Figure 19. Age Distribution of HDHPand Other FEHBP Enrollees Percent FEHBP enrollees Source: Government Accountability Office, Federal Employees Health Benefits Program First-Year Experience with High-Deductible Health Plans and Health Savings Accounts, Washington, DC: GAO, Jan. 2006.
Figure 20. Less than Half of ThoseEnrolled in Employer-Based High-Deductible Health Plans Had a Choice Percent of adults with employer-based coverage who were offered a choice of health plans • CDHP and HDHP owners are less likely to have a choice of plans from their employer • When they have a choice, the savings account is the leading reason for choosing CDHP, while premium cost is the most frequent reason for choosing HDHP. Traditional plans are chosen for low out-of-pocket costs. (n=334) (n=134) Source: P. Fronstin, S.R. Collins, Early Experience with High-Deductible and Consumer-Driven Health Plans: Findings From the EBRI/Commonwealth Fund Consumerism in Health Care Survey, EBRI Issue Brief, Dec. 2005.
Figure 21. Enrollees of HDHP/CDHPsAre Less Satisfied with Their Coverage Percent * * * * * * Difference between HDHP/CDHP and Comprehensive is statistically significant at p < 0.05 or better. Source: P. Fronstin, S.R. Collins, Early Experience with High-Deductible and Consumer-Driven Health Plans: Findings From the EBRI/Commonwealth Fund Consumerism in Health Care Survey, EBRI Issue Brief, Dec. 2005.
Figure 22. Enrollees of HDHP/CDHPsAre Less Satisfied with Out-of-Pocket Costs Percent * * * * * * Difference between HDHP/CDHP and Comprehensive is statistically significant at p < 0.05 or better. Source: P. Fronstin, S.R. Collins, Early Experience with High-Deductible and Consumer-Driven Health Plans: Findings From the EBRI/Commonwealth Fund Consumerism in Health Care Survey, EBRI Issue Brief, Dec. 2005.
Figure 23. Enrollees of HDHP/CDHPs Are Less Likely to Stay with Their Current Health Plan If They Had the Opportunity to Change Percent of adults 21–64 * Difference between HDHP/CDHP and Comprehensive is statistically significant at p < 0.05 or better. Source: P. Fronstin, S.R. Collins, Early Experience with High-Deductible and Consumer-Driven Health Plans: Findings From the EBRI/Commonwealth Fund Consumerism in Health Care Survey, EBRI Issue Brief, Dec. 2005.
Figure 24. Enrollees of HDHP/CDHPs Are Less Likely to Recommend Their Plan to a Friend or Coworker Percent of adults 21–64 * Difference between HDHP/CDHP and Comprehensive is statistically significant at p < 0.05 or better. Source: P. Fronstin, S.R. Collins, Early Experience with High-Deductible and Consumer-Driven Health Plans: Findings From the EBRI/Commonwealth Fund Consumerism in Health Care Survey, EBRI Issue Brief, Dec. 2005.
Figure 25. Employers’ Contributions Lower for Workers in HSA-Qualified HDHPs; Employees’ Premiums and Deductibles Higher Dollars $3,413 $2,823 $1,779 $933 HSA-qualified HDHP HSA-qualified HDHP All plans^ All plans^ Worker contribution Employer contribution ^ “All plans” refers to all conventional HMOs, PPOs, and POS plans in the survey,not just HDHP/HRA or HSA-qualified HDHPs. Source: Calculated based on G. Claxton et al., “What High Deductible Health Plans Look Like: Findings from a National Survey of Employers, 2005,” Health Affairs Web Exclusive, Sept., 14, 2005; J. Gabel et al., “Health Benefits in 2005: Premium Increases Slow Down, Coverage Continues to Erode,” Health Affairs, Sept./Oct. 2004.
Figure 26. Enrollees of HDHP/CDHPs Spend Higher Percent of Income on Out-of-Pocket Medical Expenses and Premiums Percent of adults 21–64 spending > 5% of income * 92 66 (n = 61) * * 53 * 38 * 42 * (n = 90) 34 * 31 * * * 17 * 12 33* 21 18* 13* 12* 3 4 10 9* <$50,000 Annual income Total Health problem * Difference between HDHP/CDHP and Comprehensive is statistically significant at p < 0.05 or better. Source: P. Fronstin, S.R. Collins, Early Experience with High-Deductible and Consumer-Driven Health Plans: Findings From the EBRI/Commonwealth Fund Consumerism in Health Care Survey, EBRI Issue Brief, Dec. 2005.
Figure 27. Enrollees of HDHP/CDHPs AreMore Likely to Delay or Avoid Getting Health Care When Sick Due to Cost Percent of adults 21–64 * (n = 61) * * (n = 90) * * * * Difference between HDHP/CDHP and Comprehensive is statistically significant at p < 0.05 or better. Source: P. Fronstin, S.R. Collins, Early Experience with High-Deductible and Consumer-Driven Health Plans: Findings From the EBRI/Commonwealth Fund Consumerism in Health Care Survey, EBRI Issue Brief, Dec. 2005.
Figure 28. Enrollees of HDHP/CDHPs Are More Likely To Skip Doses to Make Medications Last Percent of adults 21–64 with prescriptions in last 12 months * * (n = 85) (n = 50) * Difference between HDHP/CDHP and Comprehensive is statistically significant at p < 0.05 or better. ** Health problem defined as fair or poor health or one of eight chronic health conditions. Source: P. Fronstin, S.R. Collins, Early Experience with High-Deductible and Consumer-Driven Health Plans: Findings From the EBRI/Commonwealth Fund Consumerism in Health Care Survey, EBRI Issue Brief, Dec. 2005.
Figure 29. Enrollees of HDHP/CDHPs Are More Likely to Not Fill a Prescription Due to Cost Percent of adults 21–64 * * (n = 90) (n = 61) * Difference between HDHP/CDHP and Comprehensive is statistically significant at p < 0.05 or better. Source: P. Fronstin, S.R. Collins, Early Experience with High-Deductible and Consumer-Driven Health Plans: Findings From the EBRI/Commonwealth Fund Consumerism in Health Care Survey, EBRI Issue Brief, Dec. 2005.
Figure 30. Most Insured Do Not Have Quality and Cost Information to Make Informed Choices Source: P. Fronstin, S.R. Collins, Early Experience with High-Deductible and Consumer-Driven Health Plans: Findings From the EBRI/Commonwealth Fund Consumerism in Health Care Survey, EBRI Issue Brief, Dec. 2005.
Figure 31. Cost Conscious Decision-Making,by Insurance Source Percent of adults 21–64 who received health care in last 12 months * Difference between HDHP/CDHP and Comprehensive is statistically significant at p < 0.05 or better. Source: P. Fronstin, S.R. Collins, Early Experience with High-Deductible and Consumer-Driven Health Plans: Findings From the EBRI/Commonwealth Fund Consumerism in Health Care Survey, EBRI Issue Brief, Dec. 2005.
Figure 32. HSAs Won’t Solve the Cost Problem:Most Costs Are Concentrated in the Very Sick Distribution of health expenditures for the U.S. population, by magnitude of expenditure, 1997 Expenditurethreshold (1997 dollars) 1% 5% 10% $27,914 27% 50% $7,995 55% $4,115 69% $351 97% Source: A.C. Monheit, “Persistence in Health Expenditures in the Short Run: Prevalence and Consequences,” Medical Care 41, supplement 7 (2003):III53–III64.
Figure 33. Uninsured Rates High Among Adults with Low and Moderate Incomes, 2001–2005 Percent of adults ages 19–64 53 52 49 41 35 28 28 26 24 18 16 13 7 4 4 2001 2003 2005 2001 2003 2005 2001 2003 2005 2001 2003 2005 2001 2003 2005 Total Lowincome Moderate income Middle income Highincome Note: Income refers to annual income. In 2001 and 2003, low income is <$20,000, moderate income is $20,000–$34,999, middle income is $35,000–$59,999, and high income is $60,000 or more. In 2005, low income is <$20,000, moderate income is $20,000–$39,999, middle income is $40,000–$59,999, and high income is $60,000 or more. Source: S.R. Collins et al., Gaps in Health Insurance Coverage: An All-American Problem—Findings from the Commonwealth Fund Biennial Health Insurance Survey, The Commonwealth Fund, Apr. 2006.
Figure 34. Distribution of Uninsured Young Adults 19–29 by Poverty Status, 2004 200% FPL or more 31% Less than 100% FPL 40% 100%– 199% FPL 29% Source: S.R. Collins, C. Schoen, J.L. Kriss et al., Rite of Passage? Why Young Adults Become Uninsured and How New Policies Can Help, The Commonwealth Fund, updated May 2006.
Figure 35. HSAs Won’t Solve the Uninsured Problem: Income Tax Distribution of Uninsured 5% (27% tax bracket) 1% (30%–39% tax bracket) 23% (15% tax bracket) 55% (0% tax bracket) 16% (10% tax bracket) Source: S.A. Glied, The Effect of Health Savings Accounts on Health Insurance Coverage,The Commonwealth Fund, Apr. 2005.
Figure 36. Individual Market Is Not anAffordable Option for Many People Source: S.R. Collins, J.L. Kriss et al., Squeezed: Why Rising Exposure to Health Care Costs Threatens the Health and Financial Well-Being of American Families, The Commonwealth Fund, Sept. 2006.
Figure 37. Lacking Health Insurance for Any Period Undermines Quality and Efficiency Percent of adults ages 19–64 with at least one chronic condition* * Hypertension, high blood pressure, or stroke; heart attack or heart disease;diabetes; asthma, emphysema, or lung disease. Source: S.R. Collins et al., Gaps in Health Insurance Coverage: An All-American Problem—Findings from the Commonwealth Fund Biennial Health Insurance Survey,The Commonwealth Fund, Apr. 2006.
Figure 38. Adults Without Insurance Have More Problems With Lab Tests and Records Percent of adults ages 19–64 reporting the following problems in past two years: Source: S.R. Collins et al., Gaps in Health Insurance Coverage: An All-American Problem—Findings from the Commonwealth Fund Biennial Health Insurance Survey,The Commonwealth Fund, Apr. 2006.