Download
1 / 1
10 likes | 112 Vues
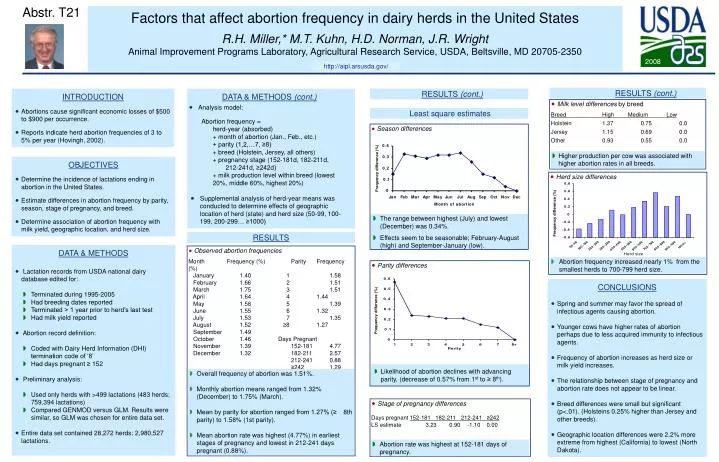
Factors that affect abortion frequency in dairy herds in the United States R.H. Miller,* M.T. Kuhn, H.D. Norman, J.R. Wright Animal Improvement Programs Laboratory, Agricultural Research Service, USDA, Beltsville, MD 20705-2350. Abstr. T21. 2008. http://aipl.arsusda.gov/. RESULTS (cont.).

E N D
Factors that affect abortion frequency in dairy herds in the United States R.H. Miller,* M.T. Kuhn, H.D. Norman, J.R. Wright Animal Improvement Programs Laboratory, Agricultural Research Service, USDA, Beltsville, MD 20705-2350 Abstr. T21 2008 http://aipl.arsusda.gov/ RESULTS (cont.) RESULTS (cont.) INTRODUCTION • Abortions cause significant economic losses of $500 to $900 per occurrence. • Reports indicate herd abortion frequencies of 3 to 5% per year (Hovingh, 2002). DATA & METHODS (cont.) • Analysis model: • Abortion frequency = • herd-year (absorbed) • + month of abortion (Jan., Feb., etc.) • + parity (1,2,…7, ≥8) • + breed (Holstein, Jersey, all others) • + pregnancy stage (152-181d, 182-211d, 212-241d, ≥242d) • + milk production level within breed (lowest 20%, middle 60%, highest 20%) • Supplemental analysis of herd-year means was conducted to determine effects of geographic location of herd (state) and herd size (50-99, 100- 199, 200-299… ≥1000) • Milk level differences by breed • Breed High Medium Low • Holstein 1.37 0.75 0.0 • Jersey 1.15 0.69 0.0 • Other 0.93 0.55 0.0 Least square estimates • Season differences Frequency difference (%) • Higher production per cow was associated with higher abortion rates in all breeds. OBJECTIVES • Determine the incidence of lactations ending in abortion in the United States. • Estimate differences in abortion frequency by parity, season, stage of pregnancy, and breed. • Determine association of abortion frequency with milk yield, geographic location, and herd size. • Herd size differences Frequency difference (%) • The range between highest (July) and lowest (December) was 0.34%. • Effects seem to be seasonable; February-August (high) and September-January (low). RESULTS DATA & METHODS • Lactation records from USDA national dairy database edited for: • Terminated during 1995-2005 • Had breeding dates reported • Terminated > 1 year prior to herd’s last test • Had milk yield reported • Abortion record definition: • Coded with Dairy Herd Information (DHI) termination code of ‘8’ • Had days pregnant ≥ 152 • Preliminary analysis: • Used only herds with >499 lactations (483 herds; 759,394 lactations) • Compared GENMOD versus GLM. Results were similar, so GLM was chosen for entire data set. • Entire data set contained 28,272 herds; 2,980,527 lactations. • Observed abortion frequencies Month Frequency (%) Parity Frequency (%) • January 1.40 1 1.58 • February 1.66 2 1.51 • March 1.75 3 1.51 • April 1.64 4 1.44 • May 1.58 5 1.39 • June 1.55 6 1.32 • July 1.53 7 1.35 • August 1.52 ≥8 1.27 • September 1.49 • October 1.46 Days Pregnant • November 1.39 152-181 4.77 • December 1.32 182-211 2.57 • 212-241 0.88 • ≥242 1.29 • Abortion frequency increased nearly 1% from the smallest herds to 700-799 herd size. • Parity differences CONCLUSIONS • Spring and summer may favor the spread of infectious agents causing abortion. • Younger cows have higher rates of abortion perhaps due to less acquired immunity to infectious agents. • Frequency of abortion increases as herd size or milk yield increases. • The relationship between stage of pregnancy and abortion rate does not appear to be linear. • Breed differences were small but significant (p<.01). (Holsteins 0.25% higher than Jersey and other breeds). • Geographic location differences were 2.2% more extreme from highest (California) to lowest (North Dakota). Frequency difference (%) • Likelihood of abortion declines with advancing parity, (decrease of 0.57% from 1st to ≥ 8th). • Overall frequency of abortion was 1.51%. • Monthly abortion means ranged from 1.32% (December) to 1.75% (March). • Mean by parity for abortion ranged from 1.27% (≥ 8th parity) to 1.58% (1st parity). • Mean abortion rate was highest (4.77%) in earliest stages of pregnancy and lowest in 212-241 days pregnant (0.88%). • Stage of pregnancy differences Days pregnant 152-181 182-211 212-241 ≥242 • LS estimate 3.23 0.90 -1.10 0.00 • Abortion rate was highest at 152-181 days of pregnancy.