Download
1 / 66
660 likes | 666 Vues
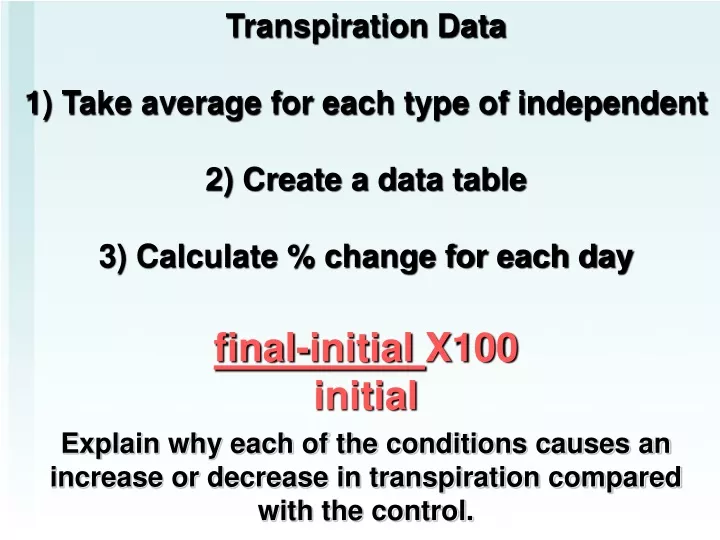
Transpiration Data 1) Take average for each type of independent 2) Create a data table 3) Calculate % change for each day final-initial X100 initial. Explain why each of the conditions causes an increase or decrease in transpiration compared with the control. Graph. X-axis?? Y-axis??

E N D
Transpiration Data1) Take average for each type of independent2) Create a data table 3) Calculate % change for each dayfinal-initial X100 initial Explain why each of the conditions causes an increase or decrease in transpiration compared with the control.
Graph • X-axis?? • Y-axis?? • Title??
1. Why was it important to calculate the PERCENT loss and not just examine water loss per plant? 2. For each condition explain why there was an increase/decrease of water loss when compared to the control.
Copy data table Bag Contents Initial Mass Final Mass Percent Change in Mass Red Yellow Clear • Fill in data, calculate changes • Which is 0, 0.2, 0.4, 0.6, 0.8 and 1.0M sucrose?
Movement of Water • Diffusion • Random movement of molecules from an area of HIGH concentration to a LOW concentration • Eventually reaches DYNAMIC EQUILIBRIUM
Osmosis • Movement of WATER through a semi-permeable membrane, from areas of high water concentration to area of low water concentration
Osmosis • Things that can affect the movement of substance across membranes • Gravity Pressure Solute concentration
Water Potential • High water potential = Purer water, LESS SOLUTE • Low water potential = less water, MORE SOLUTE
Osmotic Potential • The pressure required to stop the osmotic movement of water across a membrane
Maintaining Structure • Tugor • Water pressure within cells that maintains rigid cell walls • Plasmolysis • Loss of turgor in cells • Water diffuses OUT of cells
Objectives After doing this laboratory, students should be able to • measure the water potential of a solution in a controlled experiment • dermine the osmotic concentration of living tissue or an unknown solution from experimental data • relate osmotic potential to solute concentration and water potential
Do you understand Osmosis… .05 M .03 M Cell (compared to beaker) hypertonic or hypotonic Beaker (compared to cell) hypertonic or hypotonic Which way does the water flow? in or out of cell
Set up of a gradient • Outside the cell represented by the cup • Inside the cell represented by dialysis tubing
Part A • Make a predication, based on your knowledge of molecular size & movement, which molecule will move in or out of the tubing. • Cups will have water, bags will have 0.2, 0.4, 0.6, 0.8, 1.0 M of sucrose
Logistics • 1) Leave space in “cell”. Tie knot at the end of the tubing • 2) Beakers not labeled so record color 3) Label cups
Next time • Set up potatoes • Mass bags from part A—look at math • Water potential math • Plasmolysis with Elodea • HM: Background of lab
DispatchTake out lab packet • What is the math equation for part A? • What is the math equation for part B? Fix to Ys not Ypie • Annotate fun with water potential side 1 • Pick up poster headings • Come up if you hear your name—this is regarding your last test • Poster Symposium moved to Thur/Fri
Water will flow from an area of higher water potential to an area of lower water potential.
Question: Which way will the water flow? Into the cell or out of the cell? Answer: Water will flow into the cell. Explanation: Water will continue to flow in both directions. However, more water will be entering the cell. So the NET MOVEMENT of water will be INTO the cell. Water will flow from an area of higher water potential to an area of lower water potential (from = -0.5 to = -2.5). This will continue until dynamic equilibrium is reached. • -2.5 = -0.5
Solve problems on the back of the 1) The solute potential of pure water is _________________. 2) The solute potential of the plant cell is (greater/less than)pure water. Therefore the greater water potential is (in the cell/in the solution). Circle your choice. 3) If solute potential in the plant cell above is –6.25 bars and pressure potential is 0, what is water potential of the plant cell? _________________________ What does this indicate in terms of water movement? 4) If solute potential in the plant cell above is –6.25 bars and pressure potential is 6.25 bars, what is water potential of the plant cell? ________________________ What does this indicate in terms of water movement? 5) A plant cell has a solute potential of –4.0 and a pressure potential of 1.0. It is then placed in a solution with a water potential of –5.0. What will happen to this plant cell? 6) A plant cell has a solute potential of –2.0 and a pressure potential of 0.0. It is placed in a solution with a water potential of –1.0. What will happen to this plant cell?
Mingle at table • Lab Report/Poster—Background info
Your tasks • Set up potatoes—part B. Reuse cups. Excess potatoes go to worms • Mass your bags—dump glucose water outside for plant. Keep or throw away bags • Calculate % change in mass for A in notebook. Everyone needs to do math. (Final mass-Initial mass / Initial mass )X100= 4) Figure out which color solution is 0.0 M glucose, 0.2, 0.4, 0.6, 0.8, 1.0 and confirm with Morris-O’Hearn. Justify with data 5) Share with group WHYs for part A (hypertonic, hypotonic, water potential, diffusion/osmosis, sucrose, solute, membrane, water etc) 6)Graph zucchini data
Part C – Osmosis in Living Cells • Find change in mass in potato cores surrounded by different sucrose solutions over 24 hours. • Graph changes, find potato molarity • Calculate water & osmotic potential 1.0 M sucrose Distilled Water 0.2 M sucrose 0.4 M sucrose 0.6 M sucrose 0.8 M sucrose
Dispatch 1) Label each side as hypertonic, hypotonic or isotonic 2) What is plasmolysis? 3) What needs to be in this lab report? 4) What would you ask a former Lawndale student who is now in college?
Concentration of water Direction of osmosis is determined by comparing total solute concentrations Hypertonic - more solute, less water Hypotonic - less solute, more water Isotonic - equal solute, equal water hypotonic hypertonic water
Pumping water out Contractile vacuole in Paramecium ATP
Dispatch 1) Draw and explain exocytosis. Use the book pg 138 2) What would Darwin say about genetic engineering? Use book pg 397 and your knowledge of Darwin 3) What would Darwin say about Hardy-Weinberg? 3) The allele frequency of dominant is 0.7, what percent of population is heterozygous? Take out FRQ paper
PROBLEM ONE: The initial molar concentration of the cytoplasm inside a cell is 2M and the cell is placed in a solution with a concentration of 2.5M. • Initially, free energy is greater inside the cell than outside • It is possible that this cell is already in equilibrium with its surroundings. • Initially, solute concentration is greater outside the cell than inside. • Water will enter the cell because solute potential is lower inside the cell than outside. • The cell will become flaccid because the pressure potential is greater outside the cell than inside. • The cell is already in equilibrium with its surroundings because of the combination of pressure potential and solute potential inside and outside the cell. • Initially, the cytoplasm is hypertonic to the surrounding solution. • Initially, the numerical value of the solute potential is more negative inside the cell than outside. • Net diffusion of water will be from inside the cell to outside the cell. • At equilibrium, the molarity of the cytoplasm will have increased. • At equilibrium, the pressure potential inside the cell will have increased.
PROBLEM ONE: • A • B The cell must lose water to reach equilibrium. There is no way • pressure can build up to bring the cell to equilibrium. • A • B Water will leave the cell because solute potential is higher • inside the cell than outside. • B The cell will become more flaccid because the solute potential • is greater inside the cell than outside. • B The cell is not in equilibrium because there is no pressure • potential inside the cell and none will build up when water leaves the cell. • B ...... cell is hypotonic to the surrounding solution. • B ...... more negative outside the cell than inside. • A • A • B ..... pressure potential inside the cell will remain zero.
Osmotic Potential of Sucrose • Draw the straight line that best fits your class data. • The point where it crosses the x-axis represents the molar concentration of potato.
Osmotic Potential of Sucrose = - I C R T I = the ionization constant (for sucrose this is 1 because sucrose does not ionize in water) C= osmotic molar concentration (to be determined) R = pressure constant (handbook value R = 0.0831 liter bars/mole °K) T= temperature °K (273 + °C of solution)
Designed by Anne F. Maben These images are for viewing only and may not be published in any form
Results • Yellow—0.0 M • Dark green—0.2 M • Black—0.4 M • Blue—0.6 M • Clear—0.8 M • Olive green—1.0 M Why + 5 WORDS FROM WORD BANK
Water potential • http://www.phschool.com/science/biology_place/labbench/lab1/watcalc.html
A Review • Which size cube has the BIGGEST surface to Volume ratio? • Why is this important?
Osmotic Potential of Sucrose • Draw the straight line that best fits your class data. • The point where it crosses the x-axis represents the molar concentration of potato.
Osmotic Potential of Sucrose = - I C R T I = the ionization constant (for sucrose this is 1 because sucrose does not ionize in water) C= osmotic molar concentration (to be determined) R = pressure constant (handbook value R = 0.0831 liter bars/mole °K) T= temperature °K (273 + °C of solution)
Dispatch • Look at this data and answer WHY And use the following terms (substrate, enzyme, denature, bonds, active site)
Dispatch • A plant cell has a solute potential of –3.0 and a pressure potential of 0.0. It is placed in a solution with a water potential of –1.0. What will happen to this plant cell? Draw and write the answer • Explain what would happen to a red blood cell (RBC) placed in distilled water. Be sure to include which solution has the higher water potential in your explanation and why? • Take out lab packet.Summarize part C—microscopes of lab
Announcements • Retakes must be started and finished in the same session so study BEFORE hand. Ask questions • 2B assessment moved to Dec • Poster Sympossium—Thurs/Fri • Register for ACT/SAT and get pts in this class!
Office Hours • Week of November 18 M--NutritionT--After SchoolW--LunchTH--NoneF--Nutrition
Zucchini cores placed in sucrose solution at 27°C resulted in the percent changes below after 24 hours. Make a graph of this data with independent and dependent variables labeled and a title on the graph. Determine the molar concentration of solutes within the zucchini cells.% Change in MassSucrose Molarity 20% Distilled Water 10% 0.2 M -3% 0.4 M -17% 0.6 M -25% 0.8 M -30% 1.0 M
Zucchini cores placed in sucrose solution at 27°C resulted in the percent changes below after 24 hours. Make a graph of this data with independent and dependent variables labeled and a title on the graph. Determine the molar concentration of solutes within the zucchini cells.% Change in MassSucrose Molarity 20% Distilled Water 10% 0.2 M -3% 0.4 M -17% 0.6 M -25% 0.8 M -30% 1.0 M