Download
1 / 17
170 likes | 307 Vues
Eliminating Health Disparities: Challenges and Opportunities. Marsha Lillie-Blanton, Dr.P.H. Vice President in Health Policy The Henry J. Kaiser Family Foundation Centers for Disease Control and Prevention 19th National Conference on Chronic Disease March 3, 2005 Atlanta, GA. Figure 1.

E N D
Eliminating Health Disparities:Challenges and Opportunities Marsha Lillie-Blanton, Dr.P.H. Vice President in Health Policy The Henry J. Kaiser Family Foundation Centers for Disease Control and Prevention 19th National Conference on Chronic Disease March 3, 2005 Atlanta, GA
Figure 1 Health Determinants • Social and Environmental Conditions of Life • Family History • Health Infrastructure of Local Community • Health Coverage and Quality of Care
Figure 2 Challenges & Opportunities • Increasing Awareness and Knowledge • Assuring Adequate and Meaningful Insurance Coverage • Improving Healthcare Quality
Awareness and Knowledge of Health and Health Care Disparities
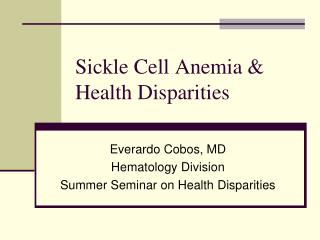
Figure 3 “How Do You Think the Average African AmericanCompares to the Average White Person in Terms of…?” LIFE EXPECTANCY INFANT MORTALITY Aware of the differ- ences Not aware of the differences Not aware of the differences Aware of the differ- ences 43% 45% 57% 54% say... say... say ”worse off” say “worse off” “just as well off” (43%) “better off” (5%) “don’t know” (9%) “just as well off” (39%) “better off” (6%) “don’t know” (9%) Whites Say Whites Say Aware of the differ- ences Not aware of the differences Aware of the differ- ences Not aware of the differences 46% 42% 53% 58% say... say... say “worse off” say “worse off” “just as well off” (42%) “better off” (8%) “don’t know” (8%) “just as well off” (36%) “better off” (10%) “don’t know” (7%) African Americans Say African Americans Say Facts: In 1997, black infant mortality was 2 ½ times higher than white (14.2 per 1,000 black infants born versus 6.0 per 1,000 white infants born), and blacks in 1996, on average, lived 6.6 years less than whites. SOURCE: Kaiser Family Foundation Survey of Race, Ethnicity and Medical Care: Public Perceptions and Experiences, October 1999 (Conducted July - Sept, 1999.
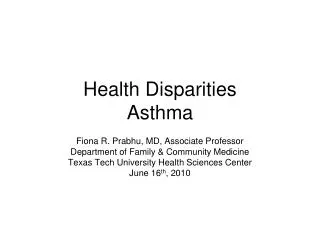
Figure 4 Heart Disease Death Rates for Adults 25-64, by Income, Race and Gender, 1979-1989 Deaths per 100,000 person years African American, Non-Latino White, Non-Latino Under $10, 000 Over $15, 000 NOTE: These data are the most recently available by race and income. SOURCE: Health, United States, 1998, Socioeconomic Status and Health Chartbook, Data Table for Figure 27.
Figure 5 What More Can Be Done To Increase Awareness/Knowledge • Outreach and informational efforts to make the facts known • Education and training of health providers through professional associations & credentialing organizations • Expand Knowledge Base (Collection and Reporting of Data by Race& Social Class; Research on Interventions)
Figure 6 People of color are more likely than whites to be uninsured or covered by Medicaid Uninsured Medicaid and Other Public Private (Employer and Individual) White, Non-Latino 165.9 million American Indian/ Alaska Native 1.5 million Two Or More Races 3.9 million Latino 38.2 million African American, Non-Latino 32.0 million Asian/ Pacific Islander 11.2 million Nonelderly Population 2003 NOTE: “Other Public” includes Medicare and military-related coverage. SOURCE: Kaiser Commission on Medicaid and the Uninsured, Health Insurance Coverage in America: 2003 Data Update, 2004.
Figure 7 One-quarter to nearly one-half of nonelderly low-income population groups are uninsured Poverty Level White, Non-Latino Latino African American, Non-Latino Asian/Pacific Islander American Indian/Alaska Native <200% White, Non-Latino Latino African American, Non-Latino Asian/Pacific Islander American Indian/Alaska Native 200%+ NOTE: Less than 200% of poverty level = $28,256 for family of 3 in 2001. SOURCE: Kaiser Commission on Medicaid and the Uninsured, Health Insurance Coverage in America: 2001 Data Update, 2003.
Figure 8 What More Can Be Done To Improve Coverage • Simplify Medicaid Enrollment and Eligibility Process • Improve Medicaid Retention of Enrollees • Develop Private Sector Financial Incentives for Low-Wage Workers • Build Public Consensus on Viable Approaches
Figure 9 Equal Likelihood Disparities Exist Among Insured Children: Underuse of Medication Among Medicaid Beneficiaries with Asthma Odds Ratio of Underuse Given the Characteristic Below + ‡ + * Difference is statistically significant after adjustment. + Compared to whites ‡ Compared to families in which the parent had graduated from high school, but had no additional education NOTE: Model adjusted for socio-demographic factors, symptom level, and reports of processes of care. The children, ages 2-16, were enrolled in managed care plans located in California, Massachusetts, and Washington state. SOURCE: Finkelstein et al., 2002.
Figure 10 Disparities Exist Among Insured Adults:Reperfusion Therapy in Medicare Beneficiaries with Acute MI Men Women Source: Canto, JG et al. New England Journal Of Medicine. 2000 April 13; 342(15):1094-100.
Figure 11 What More Can Be Done To Improve Health Care Quality and Reduce Disparities • Collect and Report Data on Patterns of Care By Race • Research on Interventions • Leadership from Professional Societies in Implementing Practice Guidelines • CMS Peer Review/Quality Improvement Activities Medicaid Specific • Cultural Competence Purchasing Guidelines for MCOs • CMS Quality Assurance Requirements for MCOs (42 DFR 438.240)
Figure 12 What can you do? • Get to know the evidence • Engage colleagues in discussions about observed differential practices • Support data collection and analysis efforts in your clinical practice settings • Review your own practices to ensure that standards of care are followed across groups • Encourage 4T’s: talent, technology, trust, tracking