Download
1 / 13
150 likes | 495 Vues
Phase Transformations - Vocabulary Phase Allotropes Phase Transitions Phase Diagram Normal vs Standard Transition Temperatures Critical Temperature Triple Point. Phase and Allotropes Phase: Uniform in physical state and chemical composition

E N D
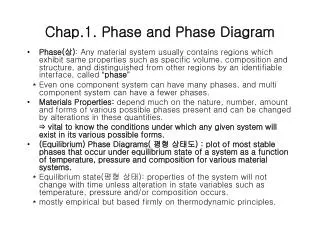
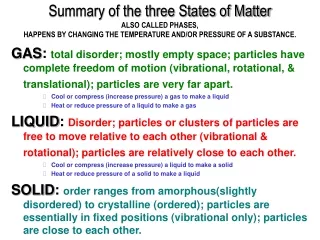
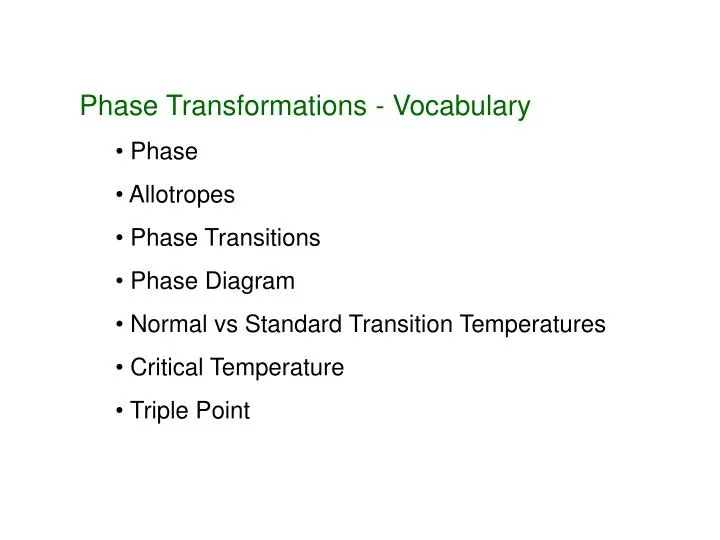
Phase Transformations - Vocabulary • Phase • Allotropes • Phase Transitions • Phase Diagram • Normal vs Standard Transition Temperatures • Critical Temperature • Triple Point
Phase and Allotropes Phase: Uniform in physical state and chemical composition Mathematically, a phase has 1 equation of state. Allotrope: One of at least two different crystalline or molecular structures of a substance Examples: Ice, Phosphorous (White and Black), Carbon (Graphite and Diamond)
Phase Transformations - Vocabulary • Phase • Allotropes • Phase Transitions • Normal vs Standard Transition Temperatures • Phase Diagram • Critical Temperature • Triple Point
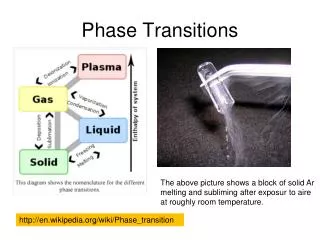
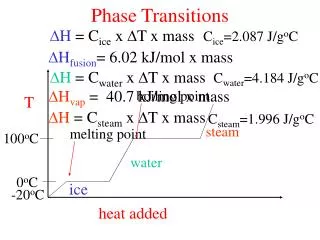
Phase Transitions Spontaneous conversions from one physical state (phase) to another. The phases are in equilibrium during a phase transition. What does that mean about S? What about G? Transition Temperature The temperature, AT A GIVEN PRESSURE, where a phase transition occurs.
Phase Diagram Normal Melting Point Standard Melting Point
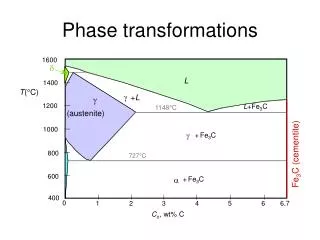
But they don’t tell the whole story. Example: Allotropes of carbon C(diamond) C(graphite) Diamond Graphite Gibbs Free Energy 2.9 kJ/Mol Phase Diagrams Phase diagrams give us a general idea about phase stability….
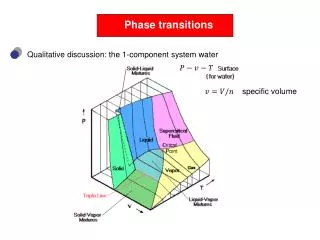
Phase Diagram Super Critical Fluid Critical Point Normal Melting Point Standard Melting Point
H2O Ice-I and liquid water boundary has a negative slope There are 6 different types of Ice (7 triple points) There is no such thing as Ice IV Ice VII isn’t shown on this diagram
Helium • Gas and solid never coexist • Two allotropes (body centered cubic and hexagonal closed packing) • Two liquid forms • A superfluid flows without any viscosity • Quantum effects are relevant 3He and 4He have different phase diagrams.
Chemical Potential () Is a quantitative measure of a substance’s ability to bring about change. For a pure substance, is the potential to bring about physical change (a phase change). Do we have a quantity that sort of describes that kind of potential? Entropy is the driving force of the universe. Molar Gibbs free energy is the definition of for a pure substance. Is going to help us quantify how the system changes under the given conditions.
Chemical Potential Any system in equilibrium must have the same chemical potential throughout the entire system The chemical potential of a solid phase changes with T differently than that of the liquid phase. for a liquid changes at a different rate than that of a solid or liquid.