Download
1 / 8
80 likes | 407 Vues
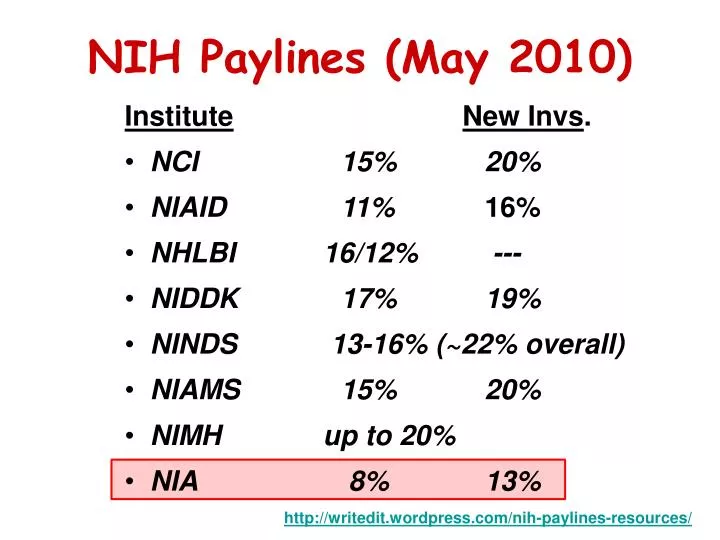
NIH Paylines (May 2010). Institute New Invs . NCI 15% 20% NIAID 11% 16% NHLBI 16/12% --- NIDDK 17% 19% NINDS 13-16% (~22% overall) NIAMS 15% 20% NIMH up to 20% NIA 8% 13%. http://writedit.wordpress.com/nih-paylines-resources/.

E N D
NIH Paylines (May 2010) • InstituteNew Invs. • NCI 15% 20% • NIAID 11% 16% • NHLBI 16/12% --- • NIDDK 17% 19% • NINDS 13-16% (~22% overall) • NIAMS 15% 20% • NIMH up to 20% • NIA 8% 13% http://writedit.wordpress.com/nih-paylines-resources/
How Did NIA Get to 8%? 30 25 NIMH NIDDK 20 NHLBI Payline (%) NCI The payline for NIA was similar to other major Institutes in 2007-8. However, the payline at NIA has declined constantly over the past 2 years. NIA 15 10 5 0 2007 2008 2009 2010 2011 Year http://www.einstein.yu.edu/ogs/NIHInfo/paylines.htm
Changes in NIA Funding and Grant Applications Since 2005 Total Budget RPG Budget # of Applications 2009* $1.08B $715M 2,113 Change +2.9% +1.3% +22% 2005 $1.05B $706M 1,729 * Data does not include ARRA funds or applications From NIA Database
Changes in Funding (Direct Costs) of RPGs Based on Size of Grant Size of Grant Direct Costs($/Yr) < $300K $300K - $1.5M $1.5M - $3M >$3M 2009 23.7% 41.9% 20.9% 13.4% Change -46% NC* +67%** +362%*** 2005 43.6% 41.0% 12.5% 2.9% * Although the total percent funding was similar for grants in this range, the percent of funds for P01 grants decreased 50% and funding for U01 grants increased over 5-fold ** Increase due equally to increased funding of large R01s, P01s, and U01s *** Increase only due to increased funding of U01 grants. From NIA Database
Changes in Funding (Direct Costs) of RPGs Based On Type of Grant Type of Grant R01, etc.* P01 U01 2009 56.3% 21.3% 21.3% Change -24%** -10%*** +719%# 2005 73.7% 23.7% 2.6% * R01, R03, R15, R21, R33, R34, R37 ** Grants under $300K decreased 45% (from $308M to $169M) while grants over $300K increased 7% from $212M to $226M. *** The cost of P01 grants under $1.5 M per year decreased 45% (from $92M to $50M while the cost of P01s over $1.5 M per year increased 34% (from $76M to $103M). # The total dollars for U01s increased from $18M to $167M (827% increase in total dollars). From NIA Database
w w w The total funds for NIA (and funds for RPGs) has changed very little between 2005 and 2009 (less than 3%) while applications have increased over 20%. Smaller grants, e.g., R01s and P01s, have decreased ~45% between 2005 and 2009 while funding of larger grants (R01s, P01s, and U01s) has increased. Funding of U01s have increased 7- to 8-fold between 2005 and 2009. Trends in RPG funding
Future Projection on NIA Payline 30 25 NIMH 20 NIDDK Payline (%) NHLBI NCI 15 NIA ? 10 5 Increase No Change 0 Decrease 2007 2008 2009 2010 2011 The major questions are: (1) will the NIA payline return to the level of the other major Institutes and (2) if so, when will this happen.
Disclaimers: • Data obtained from public sources, the Biology of Aging staff did not provide any of the information. • Any information from NIA Council came from the public hearing session of the Council. From: Arlan Richardson, Ph.D. The University of Texas Health Science Center at San Antonio