Download
1 / 9
90 likes | 240 Vues
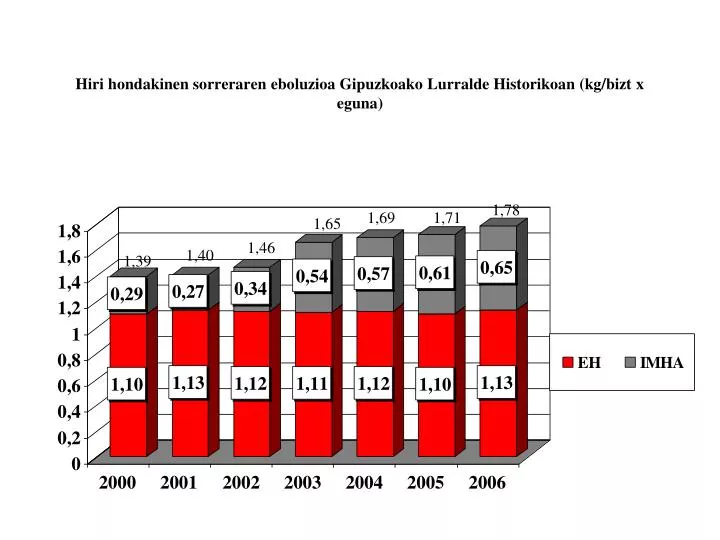
Hiri hondakinen sorreraren eboluzioa Gipuzkoako Lurralde Historikoan (kg/bizt x eguna). 1,78. 1,69. 1,71. 1,65. 1,46. 1,40. 1,39. Hiri hondakinen sorreraren eboluzioa Debabarrenako Eskualdeko Mankomunitatean (kg/bizt x eguna).

E N D
Hiri hondakinen sorreraren eboluzioa Gipuzkoako Lurralde Historikoan (kg/bizt x eguna) 1,78 1,69 1,71 1,65 1,46 1,40 1,39
Hiri hondakinen sorreraren eboluzioa Debabarrenako Eskualdeko Mankomunitatean (kg/bizt x eguna)
Hiri hondakinen sorreraren eboluzioa Debagoieneko Mankomunitatean (kg/bizt x eguna)
Hiri hondakinen sorreraren eboluzioa San Markoseko Mankomunitatean (kg/bizt x eguna)
Hiri hondakinen sorreraren eboluzioa Sasietako Mankomunitatean (kg/bizt x eguna)
Hiri hondakinen sorreraren eboluzioa Tolosaldeako Mankomunitatean (kg/bizt x eguna)
Hiri hondakinen sorreraren eboluzioa Txingudiko Zerbitzuen mankomunitatean (kg/bizt x eguna)
Hiri hondakinen sorreraren eboluzioa Urola Erdialdeko Zerbitzuen mankomunitatean (kg/bizt x eguna)
Hiri hondakinen sorreraren eboluzioa Urola Kostako Zerbitzuen Mankomunitatean (kg/bizt x eguna)