Download
1 / 13
130 likes | 148 Vues
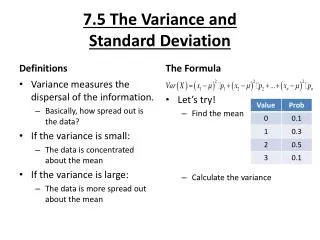
The Mean Variance Standard Deviation and Z-Scores. Chapter 2. Chapter Outline. Representative Values Variability Z-Scores Mean, Variance, Standard Deviation, and Z Scores in Research Articles. Representative Value. Uses a single number to describe a group of scores

E N D
Chapter Outline • Representative Values • Variability • Z-Scores • Mean, Variance, Standard Deviation, and Z Scores in Research Articles
Representative Value • Uses a single number to describe a group of scores • Refers to the middle of the group of scores • Mean • Median • Mode
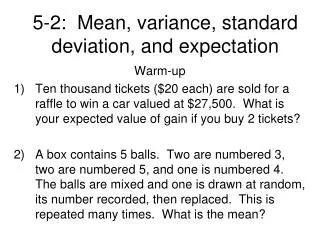
Mean • Average of a group of scores • sum of the scores divided by the number of scores • Mathematical formula for figuring the mean: M = ∑X N M = mean ∑ = sum (add up all of the scores following this symbol) X = scores in the distribution of the variable X N = number of scores in the distribution
Computing the Mean • If the scores for a particular study were 10, 5, 9, 8, 6, 5, 9, 8, 7, 6, 5, 6 • Mean = 7 • M = ∑X = 84 = 7 N 12
Mode • The most common single value in a distribution 10, 5, 9, 8, 6, 5, 9, 8, 7, 6, 5, 6 5, 5, 5, 6, 6, 6, 7, 8, 8, 9, 9, 10 • Value with the largest frequency in a frequency table • the high point or peak of a distribution’s histogram • If the distribution unimodal and perfectly symmetrical, mean = mode. • Typical way of describing the representative value for a nominal variable • rarely used with numerical variables
Median • Middle score when all scores sorted from lowest to highest • Count how many scores there are to the middle score by adding 1 to the number of scores and dividing by 2. 5, 5, 5, 6, 6, 6, 7, 8, 8, 9, 9, 10 (12 scores + 1 = 13/2 = 6.5) • For an EVEN NUMBER of scores, the median is the average of the two middle scores. 5, 5, 5, 6, 6, 6, 7, 8, 8, 9, 9, 10 (Median: 6+7/2 = 6.5) • For this group of scores (ODD NUMBER of scores): • 5, 5, 5, 6, 6, 6, 7, 8, 8, 9, 9, 10, 11 (Median = 7) (Or count the number of scores: 13 scores + 1 = 14/2 = 7)
Comparing Representative Values • The median is better than the mean or mode as a representative value when a few extreme scores would strongly affect the mean but not the median. • An outlier is an extreme score that can make the mean unrepresentative of most of the scores. 5, 5, 5, 6, 6, 6, 7, 8, 8, 9, 9, 10, 11 (Median = 7) 5, 5, 5, 6, 6, 6, 7, 8, 8, 100, 100, 100, 1000 (Median = ?)
Liar-Liar-Pants on Fire!!! • Mean Sensitive to Outliers? 5,6,10,15 • Mean = 9 • M = ∑X = 36 = 9 N 4 5,6,10,100 = 121/4 = Mean?
How Are You Doing? • Find the mean, median, and mode for the following scores: 1, 4, 3, 2, 10, 2, 1, 3, 2, 4, 3, 2, 4, 1, 3 • Which one of the above scores would be considered an outlier?
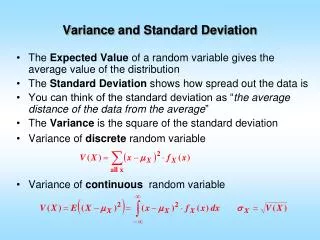
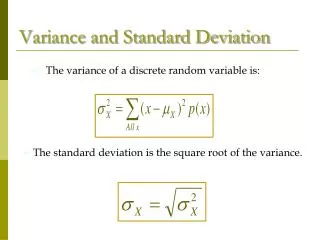
Key Points • The mean (M = (∑X) / N) is the most commonly used way of describing the representative value of a group of scores. • The mode (most common value) and the median (middle value) are other types of representative values. • Variability refers to the spread of scores on a distribution. • Variance and standard deviation are used to describe variability. • The variance is the average of the squared deviations of each score from the mean ([∑ (X-M)2] / N). • The standard deviation is the square root of the variance(√SD2). • A Z score is the number of standard deviations that a raw score is above or below the mean (Z = (X-M) / SD). • Means and standard deviations are often reported in research articles.