Download

1 / 19
190 likes | 325 Vues
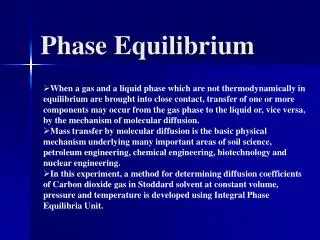
Phase Equilibrium. Makaopuhi Lava Lake. Magma samples recovered from various depths beneath solid crust. From Wright and Okamura, (1977) USGS Prof. Paper , 1004 . 1250. 1200. 1150. 1100. Temperature o c . 1050. 1000. 950. 900. 20. 60. 30. 40. 50. 0. 100. 10. 70. 80. 90.

E N D
Makaopuhi Lava Lake Magma samples recovered from various depths beneath solid crust From Wright and Okamura, (1977) USGS Prof. Paper, 1004.
1250 1200 1150 1100 Temperature oc 1050 1000 950 900 20 60 30 40 50 0 100 10 70 80 90 Percent Glass Makaopuhi Lava Lake Temperature of sample vs. Percent Glass Fig. 6-1. From Wright and Okamura, (1977) USGS Prof. Paper, 1004.
Olivine Clinopyroxene Plagioclase Opaque 1250 Liquidus 1200 olivine decreases below 1175oC 1150 Temperature oC 1100 Melt Crust 1050 1000 Solidus 950 0 10 0 10 20 30 40 50 0 10 20 30 40 50 10 0 Makaopuhi Lava Lake Minerals that form during crystallization Fig. 6-2. From Wright and Okamura, (1977) USGS Prof. Paper, 1004.
Makaopuhi Lava Lake 100 Olivine Augite Plagioclase Mineral composition during crystallization 90 80 Weight % Glass 70 60 50 60 .7 .6 70 .9 .7 .9 80 .8 .8 Mg / (Mg + Fe) An Mg / (Mg + Fe) Fig. 6-3. From Wright and Okamura, (1977) USGS Prof. Paper, 1004.
Crystallization Behavior of Melts 1. Cooling melts crystallize from a liquid to a solid over a range of temperatures (and pressures) 2. Several minerals crystallize over this T range, and the number of minerals increases as T decreases 3. The minerals that form do so sequentially, with consideral overlap 4. Minerals that involve solid solution change composition as cooling progresses 5. The melt composition also changes during crystallization 6. The minerals that crystallize (as well as the sequence) depend on T and X of the melt 7. Pressure can affect the types of minerals that form and the sequence 8. The nature and pressure of the volatiles can also affect the minerals and their sequence
The Phase Rule • F = C - f + 2 • F = # degrees of freedom • The number of intensive parameters that must be specified in order to completely determine the system • f = # of phases • Phases are mechanically separable constituents • C = minimum # of components • Chemical constituents that must be specified in order to define all phases • 2 = 2 intensive parameters • Usually temperature and pressure for geologists
OneComponent Systems SiO2 Fig. 6-6. After Swamy and Saxena (1994), J. Geophys. Res., 99, 11,787-11,794. AGU
OneComponent Systems H2O Fig. 6-7. After Bridgman (1911) Proc. Amer. Acad. Arts and Sci., 5, 441-513; (1936) J. Chem. Phys., 3, 597-605; (1937) J. Chem. Phys., 5, 964-966.
Two Component Systems Systems with Complete Solid Solution PlagioclaseAb (NaAlSi3O8 ) - An (CaAl2Si2O8) Fig. 6-8. Isobaric T-X phase diagram at atmospheric pressure. After Bowen (1913) Amer. J. Sci., 35, 577-599.
Bulk composition a = An60 = 60 g An + 40 g Ab XAn = 60/(60+40) = 0.60
A continuous reaction of the type: liquidB + solidC = liquidD + solidF
The lever principle: Amount of liquid ef = Amount of solid de where d = the liquid composition, f = the solid composition and e = the bulk composition d f e D liquidus de ef solidus
Note the following: 1. The melt crystallized over a T range of 135oC * 4. The composition of the liquid changed from b to g 5. The composition of the solid changed from c to h Numbers refer to the “behavior of melts” observations (several slides back) ** The actual temperatures and the range depend on the bulk composition **
Equilibrium melting is exactly the opposite • Heat An60 and the first melt is g at An20 and 1340oC • Continue heating: both melt and plagioclase change X • Last plagioclase to melt is c (An87) at 1475oC
Fractional crystallization: Remove crystals as they form so they can’t undergo a continuous reaction with the melt At any T, Xbulk = Xliqdue to the removal of the crystals
Partial Melting: Remove first melt as it forms Melt Xbulk = 0.60, first liquid = g remove and cool bulk = g ® final plagioclase = i
Liquid Plagioclase plus Liquid Plagioclase Note the difference between the two types of fields The blue fields are one phase fields Any point in these fields represents a true phase composition The blank field is a two phase field Any point in this fieldrepresents a bulk composition composed of two phasesat the edge of the blue fields and connected by a horizontal tie-line
Two Component Systems Olivine Fo - Fa (Mg2SiO4 - Fe2SiO4) also a solid-solution series Fig. 6-10. Isobaric T-X phase diagram at atmospheric pressure After Bowen and Shairer (1932), Amer. J. Sci. 5th Ser., 24, 177-213.