Download
1 / 55
550 likes | 1.15k Vues
SuperPave Considerations. Roy D. McQueen, P.E. Roy D. McQueen & Associates, Ltd. www.rdmcqueen.com 703 709-2540. Overview. Review EB 59A Background on Issues Research Results AAPTP ERDC FAA Requirements to Complete Specification.

E N D
SuperPave Considerations Roy D. McQueen, P.E. Roy D. McQueen & Associates, Ltd. www.rdmcqueen.com 703 709-2540
Overview • Review EB 59A • Background on Issues • Research Results • AAPTP • ERDC • FAA • Requirements to Complete Specification
Engineering Brief 59AITEM P‑401 PLANT MIX BITUMINOUS PAVEMENTS (SUPERPAVE)
References in EB 59A • TAI Superpave Mix Design, Superpave Series No. 2 (SP‑2) • TAI Performance Graded Asphalt, Binder Specification and Testing, Superpave Series No. 1 (SP-1) • Interim Item P‑401 Plant Mix Bituminous Pavements (SUPERPAVE)
Policy: Modification to Standards • Gross aircraft weights <100,000 pounds: approval at Regional Office • Gross aircraft weights > 100,000 pounds: approval by AAS-100
What’s the Big Differences Between FAA’s SuperPave & Marshall? • The Compactor! • Volumetrics measured the same • Compaction (bulk sp.g.)measured the same • Mix design & acceptance criteria are different • It’s still aggregate, sand, binder and air!
*Same requirement for Marshall Mix Also AAPTP 04-02
> 60,000 lbs. 85 Gyrations 4% VTM VMA: 13% - 14% VFA: 65% to 78% Dust to asphalt ratio Coarse & Fine FAA > 45 < 60,000 lbs. 60 Gyrations 4% VTM VMA: 13% - 14% VFA: 65% to 78% Dust to asphalt ratio Coarse & Fine FAA > 42 Primary Mix Design Criteria • A coarse gradation is defined as a gradation passing below the restricted zone. • The restricted zone is defined in the Asphalt Insitute’s Manual Superpave, SP-2.
Gradation Requirements • Runways – same as current P-401 • Taxiways • Control Points • Restricted Zone ?
> 60,000 lbs. 2.5% < VTM < 5.5% @ 85 gyrations Compaction L = 92.5% Gmm < 60,000 lbs. 2.5% < VTM < 5.5% @ 60 gyrations Compaction L = 92.5% Primary Acceptance Criteria
Major Issues Associated with Adopting SuperPave • Required number of gyrations for mix design • Volumetrics – appropriate level of VMA and VTM • Field Compaction Standard
Establishing Design Gyrations • Need to establish Ndesign for the gyratory compactor • Performance equivalent to well performing Marshall mixes • Validation testing on a variety of mixes
Stated Differently: • Make sure the new stuff works as good as the old!
Average PCI at Civil Airports 79 67 Source: Report DOT/FAA/AR-04-46
Overview of FAA P-401 • 75 blow Marshall for heavy duty • Design VTM: 2.8% - 4.2%, 3.5% typical • VMA typically 1% higher than EB 59A • TSR for moisture susceptibility (75% - 80% min) • Compaction function of lab Marshall density • PWL acceptance: • Density: 90% above 96.3% 98% average • Air voids: 90% between 2% and 5% • Limits based on actual construction data
Density Limit Derivation 98% Zs 90 PWL 10 PD L L = 98% - 1.28(1.3%) = 96.3%
Compaction 2.8% 3.5% 4.2% 0.7% 0.7% Zs Zs L=2% U=5% DL= 2% + (1.28x0.65%) = 2.8% DU= 5% - (1.28x0.65%) = 4.2%
P-401 Marshall 90% > 96.3% Marshall Avg.~ 98% lab density 50 or 75 blows 2.8% - 4.2% design VTM 2% to 5% acceptance 1% higher VMA Volumetric + Strength test P-401 Superpave 90% > 92.5% MTD Avg.~ 94.5% MTD 60 or 85 Ndes 4% design VTM 2.5% to 5.5% acceptance 1% lower VTM Strictly volumetric Primary Differences Between P-401 Marshall and P-401 Superpave
Major Issue: Ndesign • AAPTP Study • ERDC Study • FAA Study
AAPTP 04-03 Study • Approach for Ndes: • Compare In-place Density to Orig Ndes • Compare with Marshall for Equivalent Performance • Performance Tests • Mixes: • Included Southwest, West Coast Mixes • Not all well-performing – some poor • Several Military mixes • Performance Test: Flow # • Did not use P-401 volumetrics
Estimated Ndesign Values Based upon Performance Testing Airfield Gross Wt. Tire (lbs) p (psi) Ndesign Jacqueline Cochran Regional Airport 20,000 10,000 75 50 Mineral County Memorial Airport 12,500 6,250 90 50 Oxford-Henderson Airport 30,000 15,000 75 35 Little Rock Air Force Base 155,000 38,750 105 50 Naval Air Station Oceana* 66,000 33,000 240 75 Volk Field 42,500 21,250 215 75 Jackson International Airport 890,000 55,625 200 35 Newark Liberty International Airport 873,000 54,563 200 35 Palm Springs International Airport 800,000 52,500 200 N/A Spokane International Airport 400,000 100,000 200 N/A N/A – Insufficient Data to Estimate Appropriate Ndesign Value * Evaluated mix rutted in the field. Performance tests inconclusive for civil airport mixes.
Nequiv Results • 75-blow Comparisons • Range: 32 to 59 • Avg. = 49, STD = 10 • 50-blow Comparisons • Range: 25 to 40 • Avg. = 36, STD = 11 Volumetric criteria different from P-401: VMA 1% lower & VTM 1/2% higher
Ndesign Values Based Upon Research Tire Pressure, psiNdesign Less than 100 40 100 to 200 55 More than 200 70 Recommended NdesignValues for Designing Airfield Mixes Tire Pressure, psiNdesign Less than 100 50 100 to 200 65 More than 200 80 No robust “Phase 2” type validation study EB 59A N-des may be problematic To what extent did volumetrics influence results No variability analysis
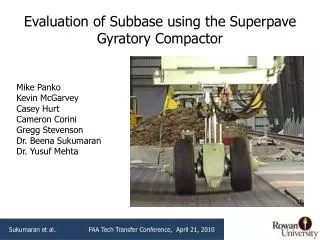
ERDC Study • Approach Similar to FAA Study, i.e. Ndes from Comparative Marshalls • Mixes Developed from P-401 Specification Requirements, i.e., Well Performing Mixes Not Considered • 75-blow Marshall, only • P-401 Volumetrics, i.e. VMA & 3.5% VTM
Variables • Mineralogy: Limestone, Granite, Gravel • Aggregate Size: ½, ¾, 1 inch Max • Gradation: Coarse & Fine Sides of P-401 Band • Sand: 10% Nat’l & 100% Crushed • Binder: PG 64-22 & PG 76-22 • Nequiv Range: 25 to 125
Analyses of Variability • Sand: • N=75 (all crushed) vs. N=59 (10% natural) • p<0.001, significantly different • Aggregate Type: • Gravel: N=50 • Granite: N=84 • Limestone: N=69 • p<0.001, significantly different
ANOVA Type Analyses (2) • Aggregate Size: • ½ inch: N=72 • ¾ inch: N=66 • 1 inch: N=80 • p=0.051, not significantly different • Gradation: • Fine: N=80 • Coarse: N=69 • p=0.047, significantly (?) different • Polymer vs. neat binders not significantly different
Conclusions • Variability too cumbersome to warrant multiple compaction levels • Ndesign based on arithmetic average of 69 with a recommended value of 70 • + 10 gyrations ----- + 0.5% VTM • EB 59A Nequiv criterion may be problematic • No robust “Phase 2” validation study
Objectives • Establish guidance for N-design • Establish specifications for designing HMA using SGC that provides performance equivalent to Marshall mixes • Verify on a range of mixes • More comprehensive than other studies
Critical Issues • Primary issue will be N-design levels consistent with 75 Marshall blows • Effect on stability & flow • SGC could also result in subtle changes in aggregate gradation to meet volumetrics • Volumetric and compaction Issues for spec development
Research Program to Establish N-equiv • Phase 1: • Determine N-equiv • Equivalent to 75-blow Marshall • Phase 2: • Validate N-equiv • Performance Tests for N-equiv
Phase 1 Subtasks - completed • Identify Mixtures and Binders • Verify Mix Designs • Perform 1st and 2nd Replicates of Gyratory Compaction & Volumetrics – 2 labs • Perform Mixture Variation Experiment • Compile, Analyze and Summarize Data
Mix Variables (1) • All well-performing mixes • Various mineralogy • Gneiss • Dolomite • Granite • Gravel • Basalt • Argillite • Diabase
Mix Variables (2) • Nominal Maximum Aggregate Size • 12.5 mm • 19.0 mm • 25.0 mm • Varying natural sand content (0%, 7.5%, 15%) • Binders • Neat asphalt • Polymers: Elastomeric (SBS) and Plastomeric (Novophalt)
Mix Designs * Phase I limited to PG 76-22
N-equivalent Results • Average: 62 • Minimum: 34 • Maximum: 99 • Standard deviation: 16 • Like other studies – range is large
Phase 2: Performance Evaluation • What is affect of asphalt content and/or gradation changes on rut resistance? • What is affect on compactibility? • What is affect on durability?
Experiment Design • Rut resistance • AMPT / flow number • APA • Compactibiltiy from compaction curve • Durability from ASTM D 4867 (modified Lottman)
EB 59A N-equiv appears to be problematic EB 59A --- 85 AAPTP ---- 55 - 65 ERDC ------ 70 FAA --------- 65 - 70 How to handle variations in N-equiv? % natural Sand Aggregate Type: Mineralogy or Angularity? Other Considerations Volumetrics Compaction Standard
Other Considerations - Volumetrics • Effect of 1% lower VMA and ½% higher air voids with Superpave: • 1.5% lower % AC by volume (~ 0.7% by wt.) • Effect of potentially lower %AC on durability
Why is VMA Important? • Va & VMA Related and Va is a pay item! • Low VMA mixes are sensitive to minor variations in asphalt content • Low VMA mixes can become tender • Low VMA mixes may not allow for sufficient film thickness to ensure durability
Other Considerations - Compaction • Effect of using %MTD in lieu of % lab for compaction control: • Example 1: 6% in-place air voids • 4% laboratory air voids, Va • 98% field compaction • Example 2: 6% in-place air voids • 2% laboratory air voids, Va • 96% field compaction