Download
1 / 30
300 likes | 427 Vues
Hungary. ANALYSIS OF THE QUESTIONNAIRES: Sport Activities. Background and objectives

E N D
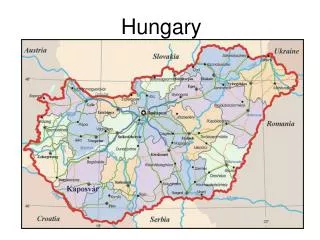
ANALYSIS OF THE QUESTIONNAIRES:Sport Activities Background and objectives The purpose of this report is to survey students’ attitude to sports and their free time activities by doing preliminary research with the young people in the Netherlands, Italy, Norway and Hungary. We investigated what kind of sports students do, prefer, what infuences them, the schools’ sport facilities, what they do to be fit. Furthermore, we tried to get insight into the activities students pursue in their free time. The results of the survey are the follows:
Competitive sports a: regularly, b: sometimes, c: rarely, d: never
Do you do any competitive sports? The students from the Netherlands are leading it again with 51%. In Hungary,Italy and Norway the situation is nearly similar between 30 and 50 %. In Hungary 70%, in Norway 50%, in Italy 40%, of the students do rarely or never do any competitive sports.
In Hungary and theNetherlands 50% of thestudentsdo team sport. InNorway and Italy 50% do team sports and 50% doindividualsports.
Every country prefers ball games. Fornearly 30% of thestudentsrunningcomesthe 2nd place. InItalytheselection is varied, after ball gamestheproportion is similar.
How often do you take part in the school’s sport activities after lessons?
In Hungary and theNetherlandsabout 70% donottake part in sport activitesafterlessons. InNorwayabout 50% donottake part inthem. InItalyabout 40-60% dosportsintheafternoon.
IntheNetherlands and Norwayinabout 40% of thecasesit is thecoachorthe P.E. teacherwhoinfluencethem. In Hungary and Italyin 25% of thecases an Olympicchampion is theinfluencer. InItaly 33% of thestudentssaysthatthefamily has influenceonthem.
InNorwaythe 36% is super!!! In Hungary, Italy and theNetherlands 50% of thestudentsare fit. InItaly 33% feeltheirhealthcondition is bad.
Whatdoyoudoto be fit? In Hungary 47% dosports and 41% Inthe Netherlands 50% dosports and 20% do free timeactivities. InItaly 30% donotdoanythingto be fit,24% dosports and 47% do free timeactivites. InNorway 37% dosports, 32% do free timeactivities and 23% donotdoanythingto be fit.