Download
1 / 1
180 likes | 1.63k Vues
Development of a Nausea Rating Scale for Children. CHOA LOGO HERE. For more information, contact: Amy Baxter MD Children’s Healthcare of Atlanta Pediatric Emergency Medicine Associates - LLC Tel. 678-344-1960 E-mail amy_baxter@PEMA-LLC.com.

E N D
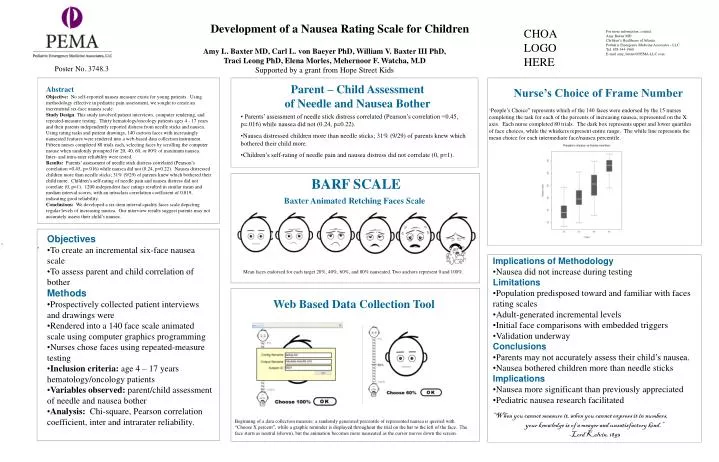
Development of a Nausea Rating Scale for Children CHOA LOGO HERE For more information, contact: Amy Baxter MD Children’s Healthcare of Atlanta Pediatric Emergency Medicine Associates - LLC Tel. 678-344-1960 E-mail amy_baxter@PEMA-LLC.com Amy L. Baxter MD, Carl L. von Baeyer PhD, William V. Baxter III PhD, Traci Leong PhD, Elena Morles, Mehernoor F. Watcha, M.D Supported by a grant from Hope Street Kids Poster No. 3748.3 Abstract Objective: No self-reported nausea measure exists for young patients. Using methodology effective in pediatric pain assessment, we sought to create an incremental six-face nausea scale. Study Design: This study involved patient interviews, computer rendering, and repeated-measure testing. Thirty hematology/oncology patients ages 4 - 17 years and their parents independently reported distress from needle sticks and nausea. Using rating tasks and patient drawings, 140 cartoon faces with increasingly nauseated features were rendered into a web-based data collection instrument. Fifteen nurses completed 80 trials each, selecting faces by scrolling the computer mouse when randomly prompted for 20, 40, 60, or 80% of maximum nausea. Inter- and intra-rater reliability were tested. Results: Parents’ assessment of needle stick distress correlated (Pearson’s correlation =0.45, p=.016) while nausea did not (0.24, p=0.22). Nausea distressed children more than needle sticks; 31% (9/29) of parents knew which bothered their child more. Children’s self-rating of needle pain and nausea distress did not correlate (0, p=1). 1200 independent face ratings resulted in similar mean and median interval scores, with an intraclass correlation coefficient of 0.819, indicating good reliability. Conclusions: We developed a six-item interval-quality faces scale depicting regular levels of increasing nausea. Our interview results suggest parents may not accurately assess their child’s nausea. Parent – Child Assessment of Needle and Nausea Bother Nurse’s Choice of Frame Number “People’s Choice” represents which of the 140 faces were endorsed by the 15 nurses completing the task for each of the percents of increasing nausea, represented on the X axis. Each nurse completed 80 trials. The dark box represents upper and lower quartiles of face choices, while the whiskers represent entire range. The while line represents the mean choice for each intermediate face/nausea percentile. • Parents’ assessment of needle stick distress correlated (Pearson’s correlation =0.45, p=.016) while nausea did not (0.24, p=0.22). • Nausea distressed children more than needle sticks; 31% (9/29) of parents knew which bothered their child more. • Children’s self-rating of needle pain and nausea distress did not correlate (0, p=1). BARF SCALE Baxter Animated Retching Faces Scale early out sit with • Objectives • To create an incremental six-face nausea scale • To assess parent and child correlation of bother • Methods • Prospectively collected patient interviews and drawings were • Rendered into a 140 face scale animated scale using computer graphics programming • Nurses chose faces using repeated-measure testing • Inclusion criteria: age 4 – 17 years hematology/oncology patients • Variables observed: parent/child assessment of needle and nausea bother • Analysis: Chi-square, Pearson correlation coefficient, inter and intrarater reliability. A B • Implications of Methodology • Nausea did not increase during testing • Limitations • Population predisposed toward and familiar with faces rating scales • Adult-generated incremental levels • Initial face comparisons with embedded triggers • Validation underway • Conclusions • Parents may not accurately assess their child’s nausea. • Nausea bothered children more than needle sticks • Implications • Nausea more significant than previously appreciated • Pediatric nausea research facilitated • “When you cannot measure it, when you cannot express it in numbers, • your knowledge is of a meager and unsatisfactory kind.” • -Lord Kelvin, 1893 Mean faces endorsed for each target 20%, 40%, 60%, and 80% nauseated. Two anchors represent 0 and 100%. Web Based Data Collection Tool Beginning of a data collection measure: a randomly generated percentile of represented nausea is queried with “Choose X percent”, while a graphic reminder is displayed throughout the trial on the bar to the left of the face. The face starts as neutral (shown), but the animation becomes more nauseated as the cursor moves down the screen.