Download
1 / 23
230 likes | 350 Vues
Temporal Changes in Dissolved Organic Carbon Composition in Tempe Town Lake. Megan Kelly and Hilairy Hartnett April 19, 2008. Conceptual Diagram. Evaporation. Salt River. Tempe Town Lake. Output to Salt River. Rain. Run-off. 2004: significant Winter rainfall. Infiltration.

E N D
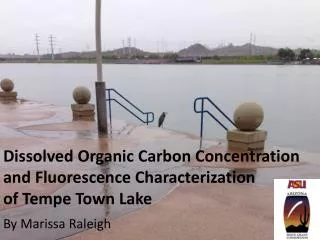
Temporal Changes in Dissolved Organic Carbon Composition in Tempe Town Lake Megan Kelly and Hilairy Hartnett April 19, 2008
Conceptual Diagram Evaporation Salt River Tempe Town Lake Output to Salt River Rain Run-off 2004: significant Winter rainfall Infiltration Recharge Wells E. Dam Raised 4 Apr 2005 Monsoon ends 10 Sep 2005 Dams Lowered 31 Dec 2004 W. Dam Raised 18 Feb 2005 Monsoon begins 18 Jul 2005
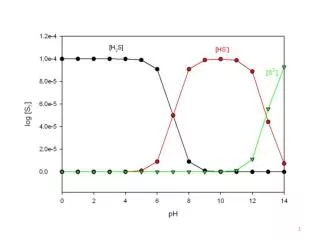
Dissolved Organic Carbon • Produced by photosynthesis • Altered or removed by microbial respiration Photosynthesis CO2 + H2O “CH2O” + O2 Respiration • Altered or removed by photo-degradation • Adsorbs to particles • Removed by flocculation
Methods • Sampling: • 2005 - daily • 2006 & 2007 - bimonthly • Measurements: • pH, conductivity, temperature, dissolved O2 • DOC analysis: • Bulk concentration • Molecular level composition
Electrospray Ionization Mass Spectrometry • Soft ionization using electric field • Two modes: Positive mode Negative mode • In: Sample diluted with methanol and water • Out: Abundance of peaks of nominal masses 30-1500 corresponding to masses of compounds
February + February - August + August - High Flow Period Rainy Period
# of compounds present in high-flow period
High-flow period Evaporative period
High-flow period Evaporative period Rainy period
Conclusions • Water chemistry indicates evaporation and primary production are dominant processes • Bulk DOC concentration indicates microbial respiration or photo-degradation • ESI-MS data suggest that different processes may dominate over time
Future Work • Comparison of mass spectrometry data before and after winter and summer rain events and algaecide applications • Experiments to determine individual compounds produced by photosynthesis, microbial degradation, and photo degradation
Thanks to: • Brad Brown, Katie Mayer, Nic Dionisio, Hilary Waterman, Jessie Shipp for sampling • Katie Alexander for discussions • Peggy Nelson and students of COURS 2007 for insights • Barrett Honors College, CAP-LTER, and ASU/NASA Space Grant for funding • This material is based upon work supported by the National Science Foundation under Grant No.DEB-0423704, Central Arizona - Phoenix Long-Term Ecological Research (CAP LTER). Any opinions, findings and conclusions or recommendation expressed in this material are those of the author(s) and do not necessarily reflect the views of the National Science Foundation (NSF).