Download

1 / 44
590 likes | 1.01k Vues
Power Plant Selection & Economics. Prof. Osama El Masry. Powerplant Selection The following must be taken into consideration: Site Selection: Land price-Close to consumer center- Load Characteristics: Daily, Yearly…. Type of Generation and Generation Units Size and Number of Units:

E N D
Power Plant Selection & Economics Prof. Osama El Masry
Powerplant Selection The following must be taken into consideration: • Site Selection: Land price-Close to consumer center- • Load Characteristics: Daily, Yearly…. • Type of Generation and Generation Units • Size and Number of Units: • Similar Units for less parts • Large units have less cost/unit energy • Stand-by units should have rating equal to the highest operating unit • Load must be equally distributed between units
Powerplant Selection • Fuel Type, Price and availability • Cooling media and alternatives • Labor availability, Experience and Salaries • Maintenance facilities and cost • Future extension due to increase in population or activities • Safety and Environmental measures
Power System Economic Operation • Power system loads are cyclical. Therefore the installed generation capacity is usually much greater than the current load. • This means that there are typically many ways we could meet the current load.
Power System Economic Operation Generation costs can vary widely, with different technologies varying in the: • Investment Cost necessary to build the generator • Running (fuel) costs to actually produce electric power • For example: • nuclear and hydro have high capital costs and low operating costs. • Natural gas generators have low capital costs, and higher operating costs.
Cost Calculation A= Annually calculated Total Cost B= Capital Cost τ= Life time for the units or the plant C= Running Cost
Cost Calculation (B)Capital Cost B=B1-B2+B3 B1= B1’+ B1’’+ B1’’’+ B1’’’’+… B1’= Study, analysis and Design costs B1’’=Units price delivered at the site B1’’’=Cost of erection and commissioning B1’’’’=Civil, Mechanical and electrical work costs B2=Price for Scrape B3=Cost for removing scrape
Cost Calculation (C) Running Cost C=C1+C2+C3+C4+.. C1=land and building rents and maintenance C2=Salaries C3=City power, water and sewage C4=Taxes and Insurance C5=Fuel cost, C6=Spare Parts and consumables C7=Equipments clothes….
COST OF POWER GENERATION SYSTEMS In order to perform feasibility study or an economic analysis, there is need to know the cost for constructing and operating a system • Capital (Investment) Cost Investment cost is also called capital cost or initial cost or first cost. It consists of equipment cost, installation cost, and soft costs. (called also project or engineering and management.)
Investment Cost • Equipment costs • Installation costs • “Soft” (or project) costs
Equipment costs • Prime mover and generator set. • Heat recovery and rejection system • Supplementary firing • Exhaust gas system and stack. • Fuel supply • Control board. • Interconnection with the electric utility • Piping. • Ventilation and combustion air systems • Shipping charges • Taxes
Installation costs • Installation permits, • Land acquisition and preparation, • Building construction, • Installation of equipment, • Documentation and as-built drawings
“Soft” (or project) costs • Architectural / engineering design fees. • Construction management fees. • Environmental studies and permitting costs. • Special consultants and inspectors. • Legal fees. • Letters of credit. • Training.
Table 1: Breakdown of investment costs for small-scale power station
2- Running (fuel) costs Operating Costs These costs include the costs of labor, but they are dominated by the fuel costs necessary to produce electrical energy (MW) from the plant. The given values reflect only the cost of fuel input to a generation plant; they do not reflect the actual costs of producing electrical energy as output from the plant because substantial losses occur during production. Some power plants have overall efficiencies as low as 35%; in addition, the plant efficiency varies as a function of the generation level Pg. We illustrate this point in what follows.
We represent plant efficiency by η. Then η=energy output/energy input. We obtain η as a function of Pg by measuring the energy output of the plant in MWhrs and the energy input to the plant in MBTU. • We could get the energy output by using a wattmeter to obtain Pg over a given period of time, say an hour, and we could get the energy input by measuring the coal tonnage used during the hour and then multiply by the coal energy content in MBTU/ton.
Egypt (Arab Republic) • Proved recoverable reserves (crude oil and NGLs, million tonnes) 495 • Production (crude oil and NGLs, million tonnes, 2005) 33.9 • R/P ratio (years) 14.7 • Year of first commercial production 1911
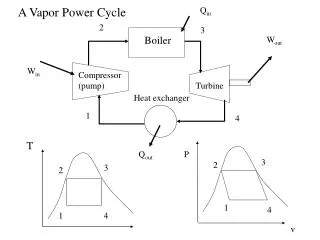
Thermal versus Hydro Generation • The two main types of generating units are thermal and hydro, with wind rapidly growing. • For hydro the fuel (water) is free but there may be many constraints on operation: • fixed amounts of water available, • reservoir levels must be managed and coordinated, • downstream flow rates for fish and navigation. • Hydro optimization is typically longer term (many months or years). • We will concentrate on thermal units and some wind, looking at short-term optimization.
Generator types Traditionally utilities have had three broad groups of generators: • “Baseload” units: large coal/nuclear; almost always on at max. • “Midload,” ‘intermediate,” or “cycling” units: smaller coal or gas that cycle on/off daily or weekly. • “Peaker” units: combustion turbines used only for several hours. during
These costs include the costs of labor, but they are dominated by the fuel costs necessary to produce electrical energy (MW) from the plant.
Generator Cost Curves Generator costs are typically represented by one or other of the following four curves • input/output (I/O) curve • fuel-cost curve • heat-rate curve • incremental cost curve
I/O Curve The IO curve plots fuel input (in MBtu/hr) versus net MW output
Fuel-cost Curve The fuel-cost curve is the I/O curve multiplied by fuel cost.
Heat-rate Curve • Plots the average number of MBtu/hr of fuel input needed per MW of output. • Heat-rate curve is the I/O curve divided by MW. Most Efficient Generation Level
Heat-rate Curve For the heat rate curve the y-axis is inverted to yield MBTU/MWhrs, which is proportional to 1/η The curve indicates that efficiency is poor for low generation levels and increases with generation, but at some optimum level it begins to diminish. Most power plants are designed so that the optimum level is close to the rated output.
Example 1 A 500 MW (net) generator is 35% efficient. It is being supplied with coal costing $2.325 per MJ and with heat content 27000kJ/kg. What is the coal usage in kg/hr? What is the cost?
Example 2 Assume a 100W lamp is left on by mistake for 8 hours, and that the electricity is supplied by the previous coal plant and that transmission/distribution losses are 20%. How much irreplaceable coal has he/she wasted?
Incremental (Marginal) cost Curve • The cost per hour increases with generation, a feature that one would expect since higher generation levels require greater fuel intake per hour. • The desired $/MWHR characteristic, called the incremental cost curve for the plant, is obtained by differentiating the plot dC/dPg. Plot of cost per hr (C) vs. generation (Pg)
Incremental (Marginal) cost Curve • Plots the incremental $/MWh as a function of MW. • Found by differentiating the cost curve.
Mathematical Formulation of Costs • Generator cost curves are usually not smooth. However the curves can usually be adequately approximated using piece-wise smooth, functions. • Two approximations predominate: • quadratic or cubic functions • piecewise linear functions • We'll assume a quadratic approximation:
Example 3 An 100 MW coal-fired plant uses a type of coal having an energy content of 28,000 kJ/kg. The coal cost is $1.5/MJ. Typical coal usage corresponding to the daily loading schedule for the plant is as follows:
For each of the four load levels, find • (a) the efficiency η, • (b) the heat rate H (kJ/kWhr) • (c) the cost per hour, C ($/hr). Also, for the loading levels of 40, 70, and 80 MW, use a piecewise linear plot of F vs P to obtain incremental cost IC as a function of unit loading P. • Then plot incremental cost as a function of unit loading.
Solution • Let T be the number of hours the plant is producing P MW while using y tons of coal. We need to compute the total energy out of the plant and divide by the total energy into the plant. (a) Note that the above expression for efficiency is dimensionless
(b)The heat rate is the amount of kJ used in the amount of time T divided by the number of kW.hrs output in the amount of time T. or
(c) C = RK where R is the rate at which the plant uses fuel and K is fuel cost in $/MJ. Note from units of P and H that R = PH C = PHK where H is a function of P. Application of these expressions for each load level yields the following results:
To obtain incremental cost , we can plot C vs. P and then get an approximation on the derivative by assuming a piecewise linear model as shown in the following figure Calculation of Incremental Cost
The quadratic function is C(P)=0.0903P2-2.9553P+604.85 The plot obtained from Matlab
Clearly, the curve is inaccurate for very low values of power (note it is above $605/hr at P=0 and decreases to about $590/hr at P=10). We can get the incremental cost curve by differentiating C(P): IC(P)=0.1806P-2.9553