Download
1 / 16
160 likes | 280 Vues
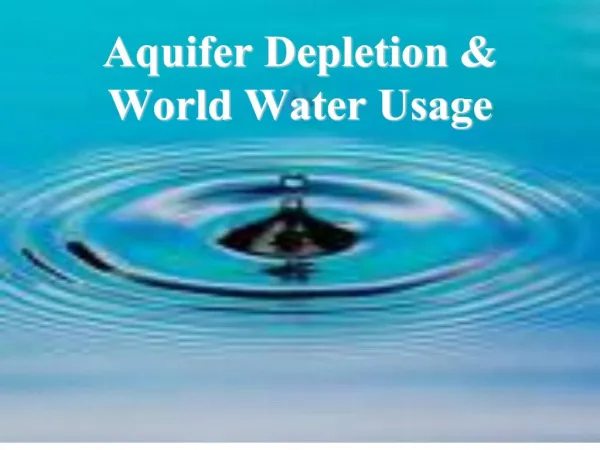
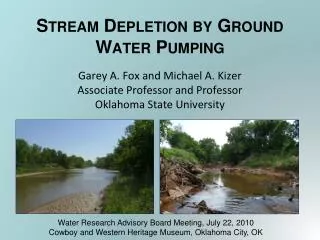
Innovations conference| Agriculture. Addressing the problem of ground water depletion. June 10, 2014. By Divya Mittal Mayur Dixit Priyank Mishra IAS (OTs) | 2013 BATCH. Agenda. Problem Statement, Assumptions & Analysis. Technical Analysis. Solution Proposed.

E N D
Innovations conference| Agriculture Addressing the problem of ground water depletion June 10, 2014 By Divya Mittal Mayur Dixit Priyank Mishra IAS (OTs) | 2013 BATCH
Agenda Problem Statement, Assumptions & Analysis Technical Analysis Solution Proposed Associated Positive Benefits Evaluation of Strategy
Krishi Pradesh is facing severe ground water depletion problem due to increased agricultural activities • Area under food grains has increased from 3.0 to 3.5 million hectares over last few decades • The state’s share in food grain production in the country: 30% wheat and 12% rice • Cultivated area under irrigation has grown from 70% to 78% in the same time period • Agricultural productivity has also seen a healthy growth along with a change in cropping pattern • Water table in the district declining at the alarming rate of 55 cm per year Data Provided • Time period for comparison (‘Few decades’): 1990 to 2014 (24 years) • Increase in area under agriculture is less than increase in area under food grain cultivation • Food grain productivity increase has been more than average productivity increase of other crops • Break up of irrigation: 1990 (50% tube well, 25% canals, 25% others); 2014 (80% tube well, 20% canals) Assumptions • Farmers have preferred growing wheat and rice over other crops due to high productivity and returns • Most important irrigation source for agriculture has been Ground Water (GW) via tube wells • Decreasing GW level can be attributed to increased demand of GW for agriculture • Erratic monsoons has further decreased the discharge to water table and increased dependence on GW • Lowered water table has increased power consumption (diesel & electric sets) to extract water • Small and marginal farmers are affected the most due to decreasing GW level Analysis Problem Statement Address the issue of GW depletion in the district by: Improving GW situation Making the farming sustainable
Analysis shows that mostly group centric issues are responsible for GW depletion by negatively affecting the recharge and discharge of water from the water table Issues related to decreased recharge of GW Quadrant 2 Quadrant 1 Issues related to increased discharge of GW Quadrant 3 Quadrant 4 Individual centric issues Group centric issues Impact Assessment
Agenda Problem Statement, Assumptions & Analysis Technical Analysis Solution Proposed Associated Positive Benefits Evaluation of Strategy
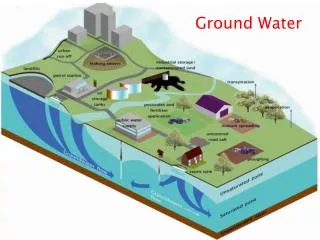
Understanding technical aspects is essential to develop a strategy and implementation plan for addressing the issue of GW depletion (1/2) Discharge (D) = function of (trans-evaporation, horizontal outflow, artificial pumping out) Recharge (R) = function of (rainfall, seepage from artificial and natural water bodies) Assessment and evaluation of GW depletion in the district • Locate, map and evaluate the capacity and number of operational bore-wells and pump-sets in the district • Map the district on the basis of (D/R) value: • (D/R) > 1 implies unsustainable pumping of GW • Simultaneously understand and map the district on the basis of water table sub-basins which might also be shared by neighboring districts (Figure1) • Choose locations and capacities of pump-sets to minimize (D/R) of overall sub-basin • Enhancing ‘R’: Assess the possibility of installing artificial recharging methods (Figure2) Figure 1 Figure 2 Assumption: Technical competency to assess and evaluate GW is available with the district and state
Understanding technical aspects is essential to develop a strategy and implementation plan for addressing the issue of GW depletion (2/2) • Figure 3 depicts 3-D water table contour mapping • Trough points indicate very low water table levels due to extensive GW discharge (‘D’) through pump-sets • Crests indicate higher water table levels due to greater natural recharge (‘R’) • Black arrows indicate natural flow of GW Figure 3 From the technical analysis the planning authority should be able to assess and find out the optimum recharging and discharging points of the water table • But the question that now arises is how to implement this strategyThe challenges/constraints are: • GW usage and extraction methods are in the domain of private property • Most of the issues identified, as shown earlier, are group-centric • Objective: How to bring a balance between the private incentives and benefits for the community at large?
Agenda Problem Statement, Assumptions & Analysis Technical Analysis Solution Proposed Associated Positive Benefits Evaluation of Strategy
To address the challenges posed we need to adapt a community based approach and emphasize on the creation of Water User Associations (WUA) • WUA: A registered entity having all farmers at a Panchayat level with the primary purpose of self regulating recharge and discharge with active support from district administration • WUA reducing ‘D’ in short term • Metering the tube wells and putting a cap/regulation on all discharge points • Dis-incentivizing excess usage and exceeding usage by penalizing individual farmers by WUA • As far as possible, close down the discharge points located in the ‘troughs’ • Promote water efficient irrigation systems like drip irrigation, sprinklers, bonding Short Term Recommendations • WUA raising ‘R’ in short term • Using community level resources and efforts to build dug wells in those plots/fields which lie close to the crests for effective recharge • Percolation tanks and check dams near the perennial streams to augment water recharge • Contour bunding on common property lands • Artificial ponds on government unused lands C AC: Reduction in demand of GW by reducing ‘D’ in the short term BD: Increase in the supply of GW by raising ‘R’ in the short term AB: Demand – Supply gap at t = 0 CD: Demand – Supply gap at t = T CD < AB: Impact in short term due to WUA interventions (Reducing the Demand Supply Gap) A D B Demand Curve of GW Supply Curve of GW t (time) = 0 t (time) = T
As shown in the analysis, since Quadrant 3 and 4 issues have maximum impact, they need to be addressed with specific strategy • Quadrant 2 • Build in-situ dug-wells for artificial recharge • Quadrant 1 • Build percolation tanks and artificial ponds on Panchayat lands • Incentivize farmers to keep land fallow on rotation basis • Grow animal feed for consumption on sharing basis Recommendations increase recharge of GW (‘R’) Long Term Recommendations • Quadrant 3 • Change the cropping mix from water intensive crops like rice to millets • Promote sustainable organic farming • Quadrant 4 • Pump capacity regulation • Regulation and relocation of pump sets (away from troughs and close to crests) Recommendations to reduce discharge of GW (‘D’) Individual centric strategy Group centric strategy C D A AC: Reduction in demand of GW by reducing ‘D’ in the short term BD: Increase in the supply of GW by raising ‘R’ in the short term AB: Demand – Supply gap at t = 0 CD: Demand – Supply gap at t = NT C = D: Creation of surplus in GW usage by long term interventions B Demand Curve of GW Supply Curve of GW t (time) = 0 t (time) = NT
Agenda Problem Statement, Assumptions & Analysis Technical Analysis Solution Proposed Associated Positive Benefits Evaluation of Strategy
Possible positive benefits of adapting proposed strategy with additional incentives for stakeholders • Greater availability of GW leading to reduced agricultural costs • Increase in cropping season and scope due to rising GW level in dry season Farmers • Opportunity of augmenting income by trading GW in the scenario of positive gap between capped extraction limits and actual GW extraction • Farmers growing water incentive crops (F1) can ‘purchase’ GW from farmers (F2) growing dry and less productive varieties • Extra income generated by F1 is hence shared between F1 and F2 Enhanced Income • Creating forward linkages for making WUA sustainable with district administration support, e.g. providing agri-credit to WUA members at lower rates, agri-insurance at lower premiums • It’s a WIN-WIN situation for WUA, farmers and the district administration Creating Forward Linkage
Agenda Problem Statement, Assumptions & Analysis Technical Analysis Solution Proposed Associated Positive Benefits Evaluation of Strategy
Evaluation of proposed strategy on the parameters of Sustainability and Stakeholder participation Evaluation table suggests that the proposed strategy scores high in sustainability parameter but there is scope for further improvement in cost-effectiveness and stakeholder participation areas
BIBLIOGRAPHY • California Water Foundation. (2014). Recommendations for Sustainable Groundwater Management: Developed Through a Stakeholder Dialogue . California: California Water Foundation. • Umar, R. (2004). Groundwater Flow Modelling and Aquifer Vulnerability Assessment Studies in Yamuna–Krishni Sub-basin, Muzaffarnagar District . New Delhi: Indian National Committee on Ground Water Central Ground Water Board (CGWB) Ministry of Water Resources (Govt. of India) . • Shah, T. (1992). Sustainable Development of Ground Water Resource: Lessons form Junagadh. Economic and Political Weekly , 515-20. • IWMI. (2012). Investing in Agricultural Water Management to Benefit Smallholder Farmers in Madhya Pradesh, India. Colombo: International Water Management Institute. • Narasimhan, T. N. (2008). Groundwater Management and Ownership . Economic and Political Weekly , 21-27. • Shah, T. (2008). India’s Master plan for Groundwater Recharge: An Assessment and Some Suggestions for Revision . Economic and Political Weekly , 41-49. • DFID. (2006). Managed Aquifer Recharge: An Assessment of its Role and Effectiveness in Watershed Management . London: Department for International Development, Government of United Kingdom.