Download
1 / 38
390 likes | 562 Vues
Lecture 3 Eng. Ismail Zakaria El Daour 2010. Probabilistic and Statistical Techniques. Summarizing and Graphing Data. - Overview - Frequency Distributions - Histograms - Statistical Graphics. Probabilistic and Statistical Techniques. Overview Important Characteristics of Data.

E N D
Lecture 3Eng. Ismail Zakaria El Daour 2010 Probabilistic and Statistical Techniques
Summarizing and Graphing Data - Overview - Frequency Distributions - Histograms - Statistical Graphics Probabilistic and Statistical Techniques
Overview Important Characteristics of Data 1. Center: A representative or average value that indicates where the middle of the data set is located. 2. Variation: A measure of the amount that the values vary among themselves. 3. Distribution: The nature or shape of the distribution of data (such as bell-shaped, uniform, or skewed). 4. Outliers: Sample values that lie very far away from the vast majority of other sample values. Probabilistic and Statistical Techniques
Frequency Distributions Key Concept When working with large data sets, it is often helpful to organize and summarize data by constructing a table called a frequency distribution, defined later. Because computer software and calculators can generate frequency distributions, the details of constructing them are not as important as what they tell us about data sets. Probabilistic and Statistical Techniques
Definition Frequency Distribution (or Frequency Table) lists data values (either individually or by groups of intervals), along with their corresponding frequencies or counts Probabilistic and Statistical Techniques
Frequency Distribution Ages of Best Actresses Original Data Probabilistic and Statistical Techniques
Frequency Distribution Ages of Best Actresses Frequency Distribution Probabilistic and Statistical Techniques
Lower Class Limits Lower Class Limits are the smallest numbers that can actually belong to different classes Probabilistic and Statistical Techniques
Upper Class Limits Upper Class Limits are the largest numbers that can actually belong to different classes Probabilistic and Statistical Techniques
20.5 30.5 40.5 50.5 60.5 70.5 80.5 Class Boundaries Class Boundaries are the numbers used to separate classes, but without the gaps created by class limits Editor: Substitute Table 2-2 Probabilistic and Statistical Techniques
25.5 35.5 45.5 55.5 65.5 75.5 Class Midpoints Class Midpoints can be found by adding the lower class limit to the upper class limit and dividing the sum by two Probabilistic and Statistical Techniques
10 10 10 10 10 10 Class Width Class Width is the difference between two consecutive lower class limits or two consecutive class boundaries Editor: Substitute Table 2-2 Probabilistic and Statistical Techniques
Reasons for Constructing Frequency Distributions 1. Large data sets can be summarized. 2. We can gain some insight into the nature of data. 3. We have a basis for constructing important graphs such as Histogram. Probabilistic and Statistical Techniques
(maximum value) – (minimum value) class width number of classes Constructing A Frequency Distribution 1. Decide on the number of classes (should be between 5 and 20). 2. Calculate class width 3. Starting point: Begin by choosing a lower limit of the first class. Using the lower limit of the first class and class width, proceed to list the lower class limits. 5. List the lower class limits in a vertical column and proceed to enter the upper class limits. 6. Go through the data set putting each data value in its class interval Probabilistic and Statistical Techniques
Constructing A Frequency Distribution 1. Decide on the number of classes (should be between 5 and 20). A useful recipe to determine the number of classes (K) is the “2 to the k rule”. This guide suggests you select the smallest number k for the number of classes such that 2k is greater than the number of observations n. Probabilistic and Statistical Techniques
class frequency Relative Frequency = sum of all frequencies Relative Frequency Distribution includes the same class limits as a frequency distribution, but relative frequencies are used instead of actual frequencies Probabilistic and Statistical Techniques
Relative Frequency Distribution Total Frequency = 76 Probabilistic and Statistical Techniques
Relative Frequency Distribution 28/76 = 37% 30/76 = 39% etc. Probabilistic and Statistical Techniques
Cumulative Frequency Distribution Probabilistic and Statistical Techniques
Cumulative Frequency Distribution Cumulative Frequencies Probabilistic and Statistical Techniques
Probabilistic and Statistical Techniques Frequency Tables
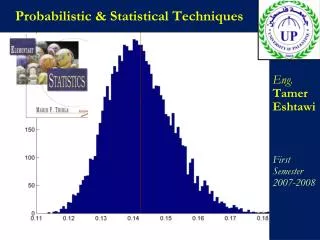
Critical Thinking Interpreting Frequency Distributions In later chapters, there will be frequent reference to data with a normal distribution. One key characteristic of a normal distribution is that it has a “bell” shape. • The frequencies start low, then increase to some maximum frequency, then decrease to a low frequency. • The distribution should be approximately symmetric. Probabilistic and Statistical Techniques
Histograms Key Concept A histogram is an important type of graph that portrays the nature of the distribution. Probabilistic and Statistical Techniques
Histogram A bar graph in which the horizontal scale represents the classes of data values and the vertical scale represents the frequencies Probabilistic and Statistical Techniques
Relative Frequency Histogram Has the same shape and horizontal scale as a histogram, but the vertical scale is marked with relative frequencies instead of actual frequencies Probabilistic and Statistical Techniques
Critical Thinking One key characteristic of a normal distribution is that it has a “bell” shape. The histogram below illustrates this. Probabilistic and Statistical Techniques
frequency diagram relative frequency diagram
Probabilistic and Statistical Techniques Examples of histograms
Probabilistic and Statistical Techniques Examples of histograms
Probabilistic and Statistical Techniques Examples of histograms
Probabilistic and Statistical Techniques Examples of histograms
Probabilistic and Statistical Techniques Examples of histograms
Probabilistic and Statistical Techniques Probability distribution