Download
1 / 22
220 likes | 323 Vues
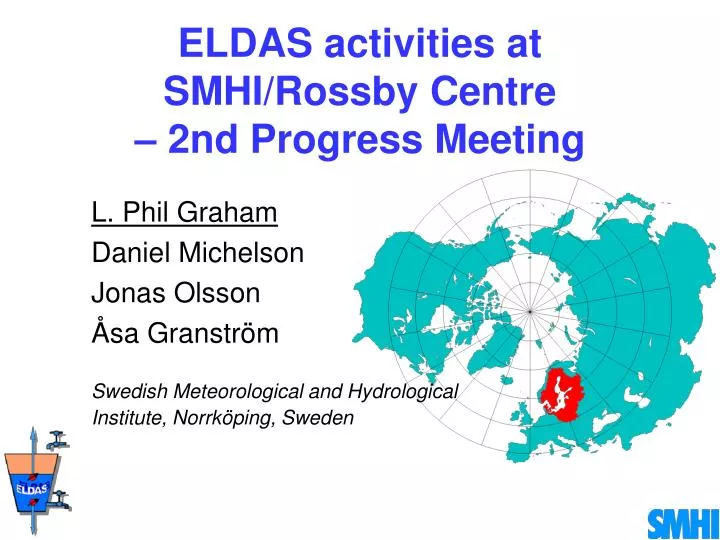
ELDAS activities at SMHI/Rossby Centre – 2nd Progress Meeting. L. Phil Graham Daniel Michelson Jonas Olsson Åsa Granström Swedish Meteorological and Hydrological Institute, Norrköping, Sweden. WP 2100 – precipitation. RR - 3 and 12-hour Gauge-adjusted accumulated precipitation.

E N D
ELDAS activities at SMHI/Rossby Centre – 2nd Progress Meeting L. Phil Graham Daniel Michelson Jonas Olsson Åsa Granström Swedish Meteorological and Hydrological Institute, Norrköping, Sweden
RR - 3 and 12-hour Gauge-adjusted accumulated precipitation Characteristics: • 2 x 2 km horizontal resolution • 3 and 12-hour temporal resolution • 32-bit depth • Uses corrected gauge observations • 3-hour covers BALTRAD area • 12-hour covers BALTEX Region • Continuous production
New Doctor! Quality Control of Weather Radar Data for Quantitative Application Daniel Michelson September 2003
Verification of Dynamic Correction Model (DCM) with 1-hr forcing Jokioinen, Finland
D33) Baltic Sea Basin D34) Swedish Basins
Comparison of Areal Precipitation Estimates by Gauges and Radar: A Case Study for a Central Swedish Catchment Jonas Olsson, Barbro Johansson, Daniel Michelson Swedish Meteorological and Hydrological Institute SE-601 76 Norrköping, SWEDEN
Torpshammar Basin • Catchment: • Area: 4 300 km² • Mean annual prec.: 700 mm • Mean altitude: 340 m.a.s.l. (range 20-540 m.a.s.l.) • Data: • PTHBV: interpolated gauge data • RADAR: gauge-adjusted radar data • Daily accumulations 2000-2002 in a 44 km grid (589 nodes)
Monthly Precipitation Torpshammar Total, 2000-2002 Differences (RADAR-PTHBV)
Daily differences - spatial dependence (2000-2002) (similar patterns for individual years)
Torpshammar Summary • GA radar data reproduce well the gauge-observed mean rainfall for 2002, but less accurately in 2000 and 2001. • GA radar data contain temporal and spatial inhomogeneities, possibly related to (i) changes in the operation and/or (ii) unstable functionality of the instruments. • Spatial pattern of differences indicates a consistent overestimation by the GA radar data located north-west of the catchment (Östersund). • High mean rainfall intensities are often underestimated and low intensities overestimated by the GA radar data. • Catchment runoff estimated by GA radar data is distinctly overestimated in the first half of the period, but accurate during 2002. (“GA” = “gauge-adjusted”)
What’s Next? • more fair test against forecast conditions • event-based analysis • Glafsfjorden basin • compare to ELDAS precipitation database • compare soil moisture for different driving P fields and against ELDAS generated fields • compare runoff
more What’s Next? • Baltic Basin runoff generation and river discharge (WP 3200) • European VIC application!
European VIC application (Variable Infiltration Capacity Model) cooperation with University of Washington
Why EuroVIC? • independent source of spatially distributed soil moisture • sets a climate perspective for SM • additional verification (e.g. evapotranspiration) • routed river flow over Europe from ELDAS models??
Details of EuroVIC - 1 • ELDAS grid (0.2° x 0.2°) • climate based 1980?-2002? • focus on ELDAS period 1999-2000 • common databases where possible (e.g. ERA-40, ECOCLIMAP) • higher resolution orography (SRTM?)
Details of EuroVIC - 2 • river routing included • databases of natural river flow preferred! (who has these?)