Download

1 / 8
80 likes | 205 Vues
Aim: How do we construct a cumulative frequency table/histogram?. To create a Cumulative Frequency Table we must:. Construct a Frequency table (intervals) Extend the Table to include a cumulative frequency column

E N D
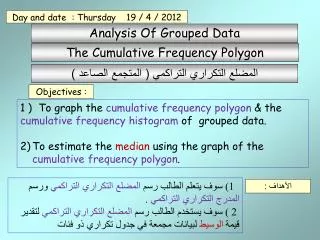
Aim: How do we construct a cumulative frequency table/histogram?
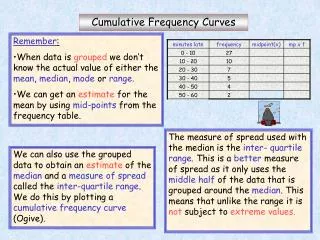
To create a Cumulative Frequency Table we must: • Construct a Frequency table (intervals) • Extend the Table to include a cumulative frequency column • The C. Freq. Column is calculated by starting from the bottom and adding each Freq. to the C. Frequency recorded on the previous row.
Frequency Table 200 150 90 30 10
To create a Cumulative Frequency Histogram: • Construct a Cumulative Frequency table • Draw/Label the Horizontal Axis (intervals) • Draw/Label the Vertical Axis “Cumulative Frequency” • Graph the Bars (No Gaps) • Last bar should contain the total frequency • Title the Graph …..The words “cumulative frequency” should appear in the title.
Horizontal axis (left to right) • Label the horizontal axis with the appropriate intervals. • Name the axis ……Test scores • If the Intervals do not begin at 0 use a “break” symbol on the axis 51-60 51-70 51-80 51-90 51-100 Test Scores (Intervals)
Vertical Axis (up and down) • Begin at zero • Number the Vertical Axis. • Label the axis “Cumulative Frequency” 150 100 50 0 Cumulative Frequency Test Scores(Interval)
Graph it….(no gaps= no gaps) 51-60 51-70 51-80 51-90 51-100
Graph it….(no gaps= no gaps) 51-60 51-70 51-80 51-90 51-100