Download
1 / 107
1.12k likes | 1.5k Vues
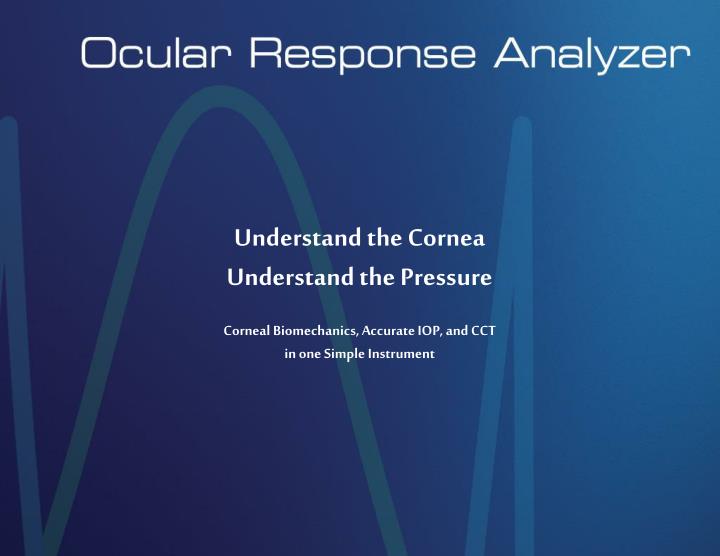
Understand the Cornea Understand the Pressure Corneal Biomechanics, Accurate IOP, and CCT in one Simple Instrument. One Device, Five Parameters. IOP G - Goldmann Correlated IOP IOP CC - Corneal Compensated IOP CH - Corneal Hysteresis CRF - Corneal Resistance Factor

E N D
Understand the Cornea Understand the Pressure Corneal Biomechanics, Accurate IOP, and CCT in one Simple Instrument
One Device, Five Parameters • IOPG - Goldmann Correlated IOP • IOPCC - Corneal Compensated IOP • CH - Corneal Hysteresis • CRF - Corneal Resistance Factor • CCT - Central Corneal Thickness
The Goldmann Tonometer has long been considered the gold standard for measuring pressure. It is based upon the Imbert-Fick Law (W = P x A) where: - W is the force to applanate - P is Intra Ocular Pressure (IOP) - A is the area applanated Measuring “Pressure”Goldmann Tonometry Principles
- Surface is dry - Volume is perfectly spherical - Surface is infinitely thin and perfectly flexible - Tear-film effect and corneal thickness effect cancel each other out Measuring “Pressure” Goldmann Tonometry Assumptions Recognizing that corneal effects and surface tension are factors which influence the measurement; Goldmann selected a tonometer tip size of 3.06mm which he believed would nullify these effects based on a constant central corneal thickness of 525 microns
Measuring “Pressure” Goldmann Tonometry Flaws • - Experimentation done on cadaver eyes • - Not representative of live corneas • - Variation in corneal thickness is significantly greater than assumed • - Variations in corneal biomechanical properties unaccounted for Accordingly, Goldmann tonometry cannot compensate for differences in corneal thickness, corneal elasticity, and many other parameters that influence tonometer readings. This applies to all other Goldmann-correlated tonometers!
Modern NCT - AT555 Non- Contact Tonometers - Invented by Dr. Bernie Grolman in the 1960’s (American Optical) - To enable OD’s in the USA to perform tonometry - Introduced in 1971 - Uses rapid air pulse technology - Easy to use - Strong Goldmann correlation - Objective: no operator bias - No anesthetic required - No risk of cross-contamination
Traditional NCT vs. GAT “In conclusion, the current study shows that the XPERT vs GAT Sdiff (1.5 mmHg) is comparable to single GAT instrument repeatability, and far superior to that of two GAT instrument repeatability/reliability.”
Ocular Response Analyzer Method of Operation
Goldmann tonometers make ‘static’ measurements. That is they derive IOP from the force measured during a steady state applanation of the cornea. Static vs. Dynamic Measurement The Ocular Response Analyzer makes a ‘dynamic’ measurement, monitoring the movement of the cornea in response to a rapid air impulse. The ‘dynamic’ nature of the ORA measurement makes possible the capture of other useful data about the eye.
Visco-Elastic System An Automotive “Strut” Assembly - Coil Spring: Static Resistance (Elasticity). strain (deformation) is directly proportional to stress (applied force), independent of the length of time or the rate at which the force is applied. - Shock Absorber: Viscous Resistance (Damping). The resistance to an applied force depends primarily on the speed at which the force is applied.
Definitions Hysteresis The phenomenon was identified, and the term coined, by Sir James Alfred Ewing in 1890. Hysteresis is a property of physical systems that do not instantly follow the forces applied to them, but react slowly, or do not return completely to their original state. Corneal Hysteresis The difference in the inward and outward pressure values obtained during the dynamic bi-directional applanation process employed in the Ocular Response Analyzer, as a result of viscous damping in the cornea.
Corneal Hysteresis: A New Ocular Parameter
CCT vs. CH - 184 normal eyes Data courtesy Mitsugu Shimmyo, MD
IOPG vs CH - 339 Normal Eyes Data courtesy New England College of Optometry
In/Out Applanation Regressions32 eyes - 3 pressure levels (ODM induced) Conclusion: Hysteresis stays constant over a wide range of pressures for the same eyes
Ocular Response Analyzer is the only instrument capable of measuring the biomechanical properties of the cornea. Corneal Biomechanics:A New Area of Clinical Interest Clinical data has shown that the Corneal Hysteresis measurement is useful in identifying corneal pathologies and may be valuable in identifying potential LASIK candidates who are at risk of developing ectasia. In consequence, the instrument is attracting interest from corneal specialists and refractive surgeons.
Corneal Biomechanics and Refractive Surgery “Refractive surgery is not an exact science. Achieving the cornea’s ultimate shape depends on our ability to predict the biomechanical response to surgery.” Cynthia Roberts, Ph.D. Associate Professor of Ophthalmology and Biomechanical Engineering, OSU “The promise of wavefront-guided laser ablation will not be fully realized until researchers gain a more complete understanding of corneal biomechanics.” John Marshall, Ph.D. “Father of the Excimer Laser” “Wavefront by itself is a great tool but we still need to understand corneal biomechanics to reap the whole benefit.” David Williams, Ph.D. Direct of The Center For Visual Science, University of Rochester
Classifying Corneal Pathologies Data courtesy Shah, Brandt, Pepose, Castellano
Classifying Corneal Pathologies • To investigate the biomechanical characteristics of eyes with: • - Fuchs’ Corneal Dystrophy (n=14) • - Post-Penetrating Keratoplasty (18±10 months postop, n=32) • - Corneal Ectasia (n=46) • - Advanced Keratoconus (CCT < 490 µm, n=15) • - Pellucid Marginalis (n=4) • - Early or Forme Fruste Keratoconus (CCT > 490 µm, n=27) • - Compared to 3 pachymetry matched control groups • Group 1: > 580 µm (n=31) • Group 2: between 510 and 580 µm (n=66) • Group 3: < 510 µm (n=17) • To compare IOP measurements using 3 testing techniques • GAT; NCT with ORA; PDCT Data courtesy Jay Pepose, MD - ASCRS 2006
Group 1 Group 2 Group 3 N 17 66 31 CCT µm 603.7 ± 20.0 543.9 ± 18.3 487.9 ± 20.0 GAT mmHg 15.3 ± 2.3 14.5 ± 3.2 12.8 ± 2.7 ORA-g mmHg 17.6 ± 3.7 15.3 ± 3.1 13.2 ± 3.5 ORA-cc mmHg 15.5 ± 3.5 15.5 ± 3.2 15.0 ± 3.0 PDCT mmHg 17.8 ± 2.3 17.5 ± 3.3 16.6 ± 2.7 CH mmHg 11.5 ± 1.8 9.7 ± 1.4 8.4 ± 1.2 CRF mmHg 11.8 ± 1.8 9.5 ± 1.3 7.8 ± 1.5 OPA mmHg 2.3 ± 1.1 2.3 ± 0.8 2.2 ± 0.9 Classifying Corneal Pathologies Control Group Differences Controls = p<0.05 comparing Group 1 or 3 to Group 2, with Student’s t-test Data courtesy Jay Pepose, MD - ASCRS 2006
Classifying Corneal Pathologies Data courtesy Jay Pepose, MD - ASCRS 2006
Fuchs’ Group 1 PKP Group 2 KCN advanced KCN/ PMD/ FFKCN Group 3 N 14 17 32 66 15 46 31 CCT µm 585.3 ± 52.5 603.7 ± 20.0 533.0 ± 47.1 543.9 ± 18.3 400.9 ± 72.2 462.6 ± 77.4 487.9 ± 20.0 CH 8.0 ± 2.0 11.5 ± 1.8 9.2 ± 1.7 9.7 ± 1.4 7.0 ± 1.4 8.1 ± 1.7 8.4 ± 1.2 CRF 8.0 ± 2.0 11.8 ± 1.8 9.2 ± 2.1 9.5 ± 1.3 5.6 ± 1.5 7.0 ± 1.8 7.8 ± 1.5 OPA 2.3 ± 1.0 2.3 ± 1.1 2.6 ± 1.2 2.3 ± 0.8 2.0 ± 0.9 2.2 ± 0.7 2.2 ± 0.9 Classifying Corneal Pathologies = p<0.05 comparing study group to its respective control group, with Student’s t-test Data courtesy Jay Pepose, MD - ASCRS 2006
Classifying Corneal Pathologies Thin Cornea with Keratoconus Thin Cornea with no ectasia CH=8.1 CRF=7.9 CH=11.2 CRF=10.8 Data courtesy Renato Ambrosio, MD - ASCRS 2006
Classifying Corneal Pathologies Data courtesy Renato Ambrosio, MD - ASCRS 2006
Pre / Post Lasik This patients pre-lasik CH is lower than the population average post-lasik CH. This patient may be a candidate for ectasia! Data courtesy Dr. David Castellano, MD / Dr. Jay Pepose, MD
Normal vs. Keratoconic Signals KERATOCONUS NORMAL Data courtesy Mr. Sunil Shah, MD
Normal vs. Fuchs’ Signals FUCHS’ NORMAL Data courtesy Dr. James Brandt, MD
Pre and Post Lasik Signals POST-LASIK PRE-LASIK Data courtesy Dr. David Castellano, MD
Signals are “Corneal Signature” NORMAL KERATOCONUS POST LASIK FUCHS’
Predicting Ectasia Risk Data courtesy Peter Hersh
Landmark Studies Many recent studies have concluded, for the first time, that controlling IOP in glaucoma patients and suspects stops or slows the progression of the disease. These studies include: • - OHTS - Ocular Hypertension Treatment Study • - AGIS - Advanced Glaucoma Intervention Study • - CNTGS - Collaborative Normal-Tension Glaucoma Study • - CIGTS - Collaborative Initial Glaucoma Treatment Study • Many of these studies have also investigated the role of the cornea in the diagnosis and management of glaucoma.
The cornea and glaucoma • Some studies have investigated Corneal thickness as a contaminating factor in measuring IOP • Others have investigated Corneal thickness as an independent indicator of glaucoma risk - Could a thin cornea be a surrogate for eyes susceptible to glaucoma damage?
Central Corneal Thickness Recently a great deal of attention has been focused on the relationship between central corneal thickness (CCT) and Goldmann-obtained IOP values. Studies have found that corneal thickness influences the accuracy of IOP measurements. - Thicker corneas, on average, tend to overstate GAT IOP values - Thinner corneas, on average, tend to understate GAT IOP values HOWEVER, this is only true ON AVERAGE for large populations - The IOP/CCT relationship is actually quite weak and varies from study to study, making correcting IOP based on CCT impractical
The problem with CCT 184 Normal Eyes Data courtesy New England Collage of Optometry
Two corneas, both 0.65 mm One is clear The other is edematous The first reads high (compared to manometry), the second low Thickness can’t be the whole answer Other corneal factors besides thickness determine response of corneo-scleral shell to force Hydration Connective tissue composition Bio-elasticity The problem with CCT Data courtesy Harry Quigley, Wilmer Eye Institute
“We should not assume that corneal thickness is the parameter of greatest interest in monitoring glaucoma or in determining what features of the eye are important in optic nerve damage”. “Physiology is more important than anatomy” - Harry Quigley, Director of Glaucoma Service, Wilmer Eye Institute The problem with CCT “Adjusting IOP by means of a fixed CCT algorithm is almost certainly wrong in the majority of our patients and is attempting to instill a degree of precision, into a relatively flawed instrument (the Goldmann tonometer), that simply is not there” - James Brandt, Director of Glaucoma Services, UC Davis
CH distribution - Normals & Glaucoma Data courtesy New England College of Optometry and Mitsugu Shimmyo, MD
Additional Parameters: P1 and P2 provide independent information about the eye
Background Data courtesy Dr. David Castellano, MD / Dr. Jay Pepose, MD