Download
1 / 26
260 likes | 531 Vues
Cost and Supply of Geothermal Power. Susan Petty Black Mountain Technology. The Geothermal Resource Base. USGS Circular 790 Released in 1979 Based on data from 1950’s-1978 Bonneville Power Authority Pacific Northwest only More detail for Northwest resources

E N D
Cost and Supply of Geothermal Power Susan Petty Black Mountain Technology
The Geothermal Resource Base • USGS Circular 790 • Released in 1979 • Based on data from 1950’s-1978 • Bonneville Power Authority • Pacific Northwest only • More detail for Northwest resources • State Geothermal Resource Maps • All states with geothermal resources • Maps don’t evaluate resource potential
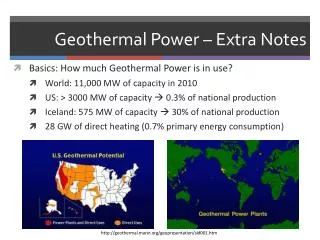
US Geothermal Resource Estimates • USGS Circular 790 • Estimates recoverable heat and potential power output • Identifies resources on basis of surface manifestations • 23,000 MWe from identified hydrothermal resources • No assumptions about cost to produce power • Enhancing permeability of identified resources a possibility • Does not include hot dry rock • Cuts off electric power generation at 150°C
US Geothermal Resource Estimates • BPA Northwest Resource Evaluation • More detailed estimates for Washington, Oregon, Idaho and Montana • Adds ~3500 MWe to USGS estimates for area • Does not rely solely on presence of hot springs • Considers cost in ranking resources for development
Other Geothermal Resource Data • State geothermal resource maps • Currently being updated by INL and some state geological surveys or universities • Includes areas of high heat flow, surface manifestations and wells • Geothermal Map of the US • Recently updated • Based on heat flow calculated from shallow and deep well temperature measurements • Data available on web • Thermal Springs Map of the US • Springs with measured temperatures above regional groundwater temperature • USGS Updated Basin and Range Temperature Gradient Database • Now available on web from http://pubs.usgs.gov/of/1999/of99-425/webmaps/home.html. • Includes data from industry exploration
Geothermal Map of North America Detail of Utah
Temperature at 6 km With depth to bedrock
Resource From Heat Mining • Area in Utah that is above 240°C at 6 km • Total heat in place converted to electricity - 136,000 MWe for 1000 years • Recoverable heat at 20% recovery – 27,000 MWe
Great Basin Geothermal Gradient Map
Cost of Geothermal Power • Sandia – Petty, et al, Impact of Technology on Cost of Geothermal Power • EPRI – Brugman, et al, Next Generation Geothermal Power Plants - 1996 • Renewable Northwest Project: Geothermal Power - 2002
Modeling Cost of Geothermal Power • IM-GEO – Impact of Technology on Cost of Geothermal Power – Completed 1990, Updated – 1994 • Used to build supply curves – 1992 • Input for NEMS modeling by EIA • EIA currently using this study escalated to current $ • GETEM – Geothermal Energy Technology Enhancement Model • In Beta testing • Based on drilling costs from Sandia study 2004 • Plant capital costs from reports by Ormat and Power Engineers and on EPRI 1996 study.
Modeling Data Requirements • Resource Data • Temperature • Depth • Flow per well • Size of resource • Temperature/Pressure decline rate • Drilling difficulty – geology • Exploration success rate • Confirmation success rate • Plant Data • Binary or Flash • Size of plant • Number of units • Binary or flash • Pumped or Self Flow • O&M as % of cost • Economic Data • Fixed Charge Rate • Utilization Factor % • Contingency %
Cost Modeling Results Binary Basin and Range Shallow Wells– 5000 ft wells, 150°C, 2000 gpm, Basin and Range drilling, Air-cooled binary plant, pumped wells
Break Down of Geothermal Power Cost Binary Basin and Range Shallow Wells – 2000 ft wells, 150°C, 2000 gpm, Basin and Range drilling, Air-cooled binary plant, pumped wells
Cost Modeling Results Binary Base Case – 5000 ft wells, 150°C, 2000 gpm, Basin and Range drilling, Air-cooled binary plant, pumped wells
Break Down of Geothermal Power Cost Binary Base Case – 5000 ft wells, 150°C, 2000 gpm, Basin and Range drilling, Air-cooled binary plant, pumped wells
Cost Modeling Results Flash Base Case – 8000 ft wells, 200°C, 500K lb/hr, Basin and Range drilling, Dual Flash plant
Break Down of Geothermal Power Cost Flash Base Case – 8000 ft wells, 200°C, 500K lb/hr, Basin and Range drilling, Dual Flash plant
Cost Modeling Results EGS High Temperature Case - 240°C at 6 km, pumped wells, 395 gpm
Cost Modeling Results EGS High Temperature Case - 240°C at 6 km, pumped wells, 510 gpm with technology improvement
Break Down of Geothermal Power Cost EGS High Temperature Case - 240°C at 6 km, pumped wells, 510 gpm, with technology improvement