Download
1 / 27
270 likes | 273 Vues
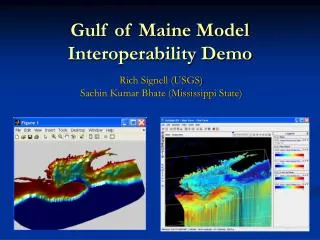
This progress report outlines the upgrades to the Gulf of Maine Integrated Model System, including the upgrade to WRF, data assimilation experiments, and the introduction of the Northeast Ocean Forecast System. The report also includes comparisons of MM5 and WRF models with observations, as well as information on the regional and local domains of the model system.

E N D
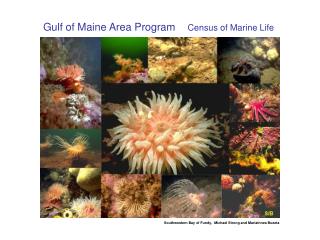
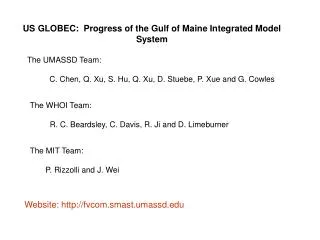
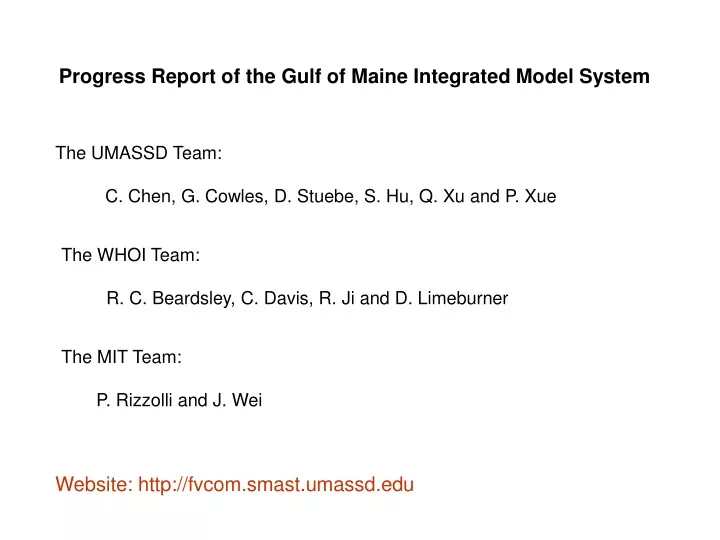
Progress Report of the Gulf of Maine Integrated Model System The UMASSD Team: C. Chen, G. Cowles, D. Stuebe, S. Hu, Q. Xu and P. Xue The WHOI Team: R. C. Beardsley, C. Davis, R. Ji and D. Limeburner The MIT Team: P. Rizzolli and J. Wei Website: http://fvcom.smast.umassd.edu
Outlines Upgrade the MM5 to WRF (Meteorological Forcing) Upgrade the GoM FVCOM to the third generation Data assimilation experiments for the GLOBEC hindcast years Introduction of the Northeast Ocean Forecast System (NeCOFS)
BC’s North American Meso-scale (NAM) Weather Model Satellite SST Buoy Winds Insolation assimilation Local Weather Model (WRF)/MM5 Heat Flux Wind Stress P-E U,V Form Drag BC’s Inflow GoM/GB FVCOM Surface Wave Model Global Tidal Model KEY U,V Waves, Langmuir Cells PAR Freshwater Input Satellite SST, U,V Buoy T,S,U,V Existing Models MASS Coastal FVCOM FVCOM System Groundwater Input Under developed assimilation Nutrients, Phytoplankton Ocean Colors BC’s Data Generalized Ecosystem Model (FVCOM Module) Sediment Transport Model (FVCOM Module) Larval data VPR Multi-Stage Zooplankton Model (IBM and concentration-based) Fish Larval Model (IBM and concentration-based) The Gulf of Maine Integrated Model System
Regional Domain: 9km Domain 2 Domain 1 Domain 3 Domain 2 Large domain: 27km Domain 3 Hindcast Local domain: 3 km
Model u(m/s) v(m/s) t(°C) MM5 2.7 3.4 2.9 3.9 1.4 1.8 WRF 2.4 3.0 2.8 3.5 1.4 1.8 Comparison of MM5 and WRF with observations at all buoys Forecast Errors for May 2-10, 2007 on 11 buoys
Second Generation Third Generation • Horizontal resolution: 0.3-1.0 km in the coastal region; • Generalized terrain-following coordinates: 46 layers: 10 uniform layers in the surface and bottom boundary layers, respectively. • 1500 m cutoff off Georges Bank • Capable to nest to the coasta-estuarine model with a horizontal resolution of ~10 -500 m; • Horizontal resolution: 0.5-1.0 km in the coastal region; • Sigma-coordinates: 31 vertical layers • 300 m cutoff off Georges Bank
Second Generation Third Generation Surface sigma level: don’t resolve the near-surface current because the horizontal velocity is calculated at the mid-point of the first sigma layer, which changes with depth. At the 2-m below the surface: Resolve the near-surface current better with the thin uniform layers at the surface..
Second-generation FVCOM Third-generation FVCOM Observed 2 m at GoMOOS Buoy E 50 m at GoMOOS Buoy E 3rd FVCOM shows a certain level improvement than 2nd FVCOM for some relatively large wind events.
Data Assimilation Experiments Optimal Interpolation (OI) assimilated all T/S data into the model as monthly arrays Ensemble Kalman Filter to assimilate all T/S data into the model as adaptive samplings Examples were made for the 1998 hindcast reanalysis experiment Note: The ensemble Kalman filter experiment results were made by the graduate student Xue and he is in hospital, so the results are not included in this talk.
Jan Feb Mar Apr Aug May June July Spt Oct Nov Dec The hydrographic data sites: January-December, 1998
Near-surface, April 1998 With no OI Assimilation With OI Assimilation
Velocity (OI)-Velocity (No-OI); Temperature (OI)-Temperature (No-OI)
Near-surface, August 1988 No OI With OI
Velocity (OI)-Velocity (No-OI); Temperature (OI)-Temperature (No-OI)
At 150-m, August 1998 NO-OI With-OI Note: Temperature contour needs to check (interpolation method?)
NeCOFS Model Flow Diagram: 1.0 Stage: 1 (midnight) Crontab starts NeCOFS Day 0 ~ now Day# -10 -5 -4 -3 -2 -1 0 1 2 3 wrf forecast data wrf hindcast data fvcom data (results) river data sst data (Previous Hindcast) (Previous Forecast) 1: 2: 3: Current Process
NeCOFS Model Flow Diagram: 1.0 Stage: 2 (midnight) Upate River Data Day# -10 -5 -4 -3 -2 -1 0 1 2 3 wrf forecast data wrf hindcast data fvcom data (results) river data sst data (Previous Hindcast) (Previous Forecast) 1: Download USGS data and update data file 2: 3: Current Process
NeCOFS Model Flow Diagram: 1.0 Latest available SST data is already several days old Stage: 3 (00:10) Upate SST Data Day# -10 -5 -4 -3 -2 -1 0 1 2 3 wrf forecast data wrf hindcast data fvcom data (results) river data S 2 sst data (Previous Hindcast) (Previous Forecast) 1: Download JPL SST and update OI assim 2: 3: Current Process
NeCOFS Model Flow Diagram: 1.0 Continuous WRF data archive is automatically updated with new results Stage: 4 (00:15) Run WRF Day# -10 -5 -4 -3 -2 -1 0 1 2 3 wrf forecast data wrf hindcast data fvcom data (results) river data S 2 sst data (Previous Hindcast) (Previous Forecast) S 3 1: WRF Forecast 2: WRF Hindcast 3: Current Process
NeCOFS Model Flow Diagram: 1.0 FVCOM overwrites old results updating time period of new WRF data. Stage: 5 (08:00) Start FVCOM hindcast Day# -10 -5 -4 -3 -2 -1 0 1 2 3 wrf forecast data (Still running) wrf hindcast data S 4 fvcom data (results) river data S 2 sst data (Previous Hindcast) (Previous Forecast) S 3 1: WRF Forecast 2: FVCOM Hindcast 3: Current Process
NeCOFS Model Flow Diagram: 1.0 FVCOM forecast runs till end of available WRF data Stage: 6 (11:00) Start FVCOM Forecast Day# -10 -5 -4 -3 -2 -1 0 1 2 3 wrf forecast data S 5 wrf hindcast data S 4 fvcom data (results) S 5 river data S 2 sst data (Previous Hindcast) (Previous Forecast) S 3 1: FVCOM Forecast 2: 3: Current Process
NeCOFS Model Flow Diagram: 1.0 New Results are Automatically posted to the web site! Stage: 7 (12:00) NeCOFS Forecast Finished! Day# -10 -5 -4 -3 -2 -1 0 1 2 3 wrf forecast data S 5 wrf hindcast data S 4 fvcom data (results) S 5 S 6 river data S 2 sst data (Previous Hindcast) (Previous Forecast) S 3 1: 2: 3: Current Process
Publications (only physical compoment) • Chen, C. R. C. Beardsley, Q. Xu, G. Cowlesand R. Lime burner, 2007. Tidal dynamics in the Gulf of Maine and New England Shelf: An application of FVCOM. Journal of Geophysical Research, in revision • Chen, C., H. Huang, R. C. Beardsley, H. Liu, Q. Xu, and G. Cowles, 2007. A finite-volume numerical approach for coastal ocean circulation studies: comparisons with finite-difference models. Journal of Geophysical Research, 112, C03018, doi:10.1029/2006JC003485. • Chen, C., Q. Xu, R. Houghton and R. C. Beardsley, 2007. A Model-Dye Comparison Experiment in the Tidal Mixing Front Zone on the Southern Flank of Georges Bank. Journal of Geophysical Research, in press. • Chen, C., R. C. Beardsley, Q. Xu and R. Limeburner, Tidal Dynamics in the Gulf of Maine and New England Shelf: An Application of FVCOM. Deep Sea Research II: GLOBEC/GB Special Issue. In revision. • Chen, C., P.Malanotte-Rizzoli, J. Wei, R. C. Beardsely, Z. Lai, P. Xue, S. Lyu, Q. Xu, J. Qi and G. Cowles, Validation of Kalman filters for coastal ocean problems: an experiment with FVCOM. Journal of Geophysical Research, submitted. • Cowles, G., Chen, C., Lentz, S.L., Beardsley, R.C., and Xu, Q., 2007. Validation of Model-Computed Low Frequency Currents on the New England Shelf. Journal of Geophysical Research, accepted with revision. • Huang, H. C. Chen, G. Cowles, C. D. Winant, R. C. Beardsley, K. S. Hedstrom, and D. B. Haidvogel, 2007. FVCOM validation experiments: comparisons with ROMS for three idealized test problems. Journal of Geophysical Research, submitted. • Lai, Z, C. Chen, G. Cowles and R. C. Beardsley, A non-hydrostatic version of FVCOM-validation experiment I: surface standing and solitary waves. In preparation. • Lai, Z., C. Chen, G. Cowles and R. C. Beardsley, A non-hydrostatic version of FVCOM-valiation experiment II: lock exchange flow and internal solitary waves. In preparation.
On-going Activities Complete the data assimilation experiments with OI and K-Filters. Coupled UG-SWAN into FVCOM to include the dynamics of the current and wave interaction. Improve the model dynamics with more accurate and complete river discharges. Apply the non-hydrostatic version of FVCOM (NH-FVCOM) to resolve the internal waves on the slope and wintertime convection.