Download
1 / 37
370 likes | 494 Vues
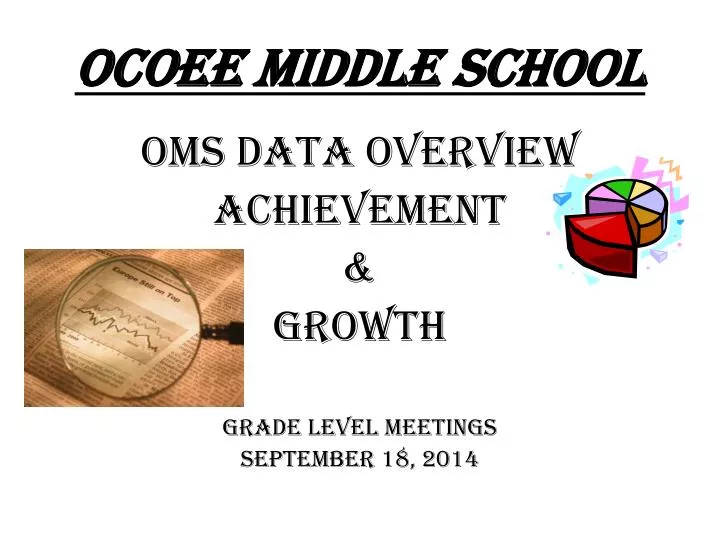
OCOEE MIDDLE SCHOOL. Oms data overview Achievement & Growth Grade Level meetings September 18, 2014.

E N D
OCOEE MIDDLE SCHOOL Oms data overview Achievement & Growth Grade Level meetings September 18, 2014
https://vimeo.com/99148091Finding Joy –Simple Truthshttp://www.simpletruths.com/movies/happiness-videos.html?utm_source=silverpop&utm_medium=email&utm_campaign=ecommerce&utm_content=09_03_14_ST_WS_Top-Happiness-Videos_Movie_B_Corporate&spMailingID=21384810&spUserID=NzkwMTcxMTU5NjgS1&spJobID=400180463&spReportId=NDAwMTgwNDYzS0 Kid President’s Pep Talk to Teachers & Students (3:55) https://www.youtube.com/watch?v=RwlhUcSGqgs
ACHIEVEMENT DATA OCOEE MIDDLE SPRING 2014 TCAP
OMS as a Whole… READING & MATH State OMS
Science & Social Studies State OMS
AMOs - Annual Measurable Objectives= Accountability Targets MET: • 3-8 RLA – 2013 55.9% Target 58.7 2014 58.9% + • 3-8Math- 2013 55.3% Target 58.1 2014 52.3% SH • 7th RLA - 2013 51.5% Target 54.5 2014 62.1% + • 7th Math- 2013 54.5% Target 57.3 2014 56.0% SH Gap Closures MET: • BHN Math- 2013 GAP 17.5% T. 16.4 2014 8.3% + • ED Math – 2013 GAP 24.7% T. 23.2 2014 22.4% + • ED RLA - 2013 GAP 26.5% T. 24.8 2014 23.4% +
AMOs - Annual Measurable Objectives= Accountability GAP Closures MISSED: • BHN RLA – 2013 10.3% T. 9.7 2014 10.5% (-.8) • SWD Math- 2013 19.9% T. 18.7 2014 32.3% (-13.6) • SWD RLA – 2013 32.5% T. 30.5 2014 35.4% (-4.9)
2015 TARGETS… • 3-8 RLA – 58.9% to 61.5% (increase +2.6%) • 3-8 Math – 52.3% to 55.3% (increase +3.0%) • 7th RLA – 62.1% to 64.5% (increase +2.4%) • 7th Math – 56% to 58.8% (increase +2.8%) GAPS: BHN: Math- 8.3% to 7.8%(decrease .5%) Reading- 10.5% to 9.8%(decrease .7%) ED: Math- 22.4% to 21.0% (decrease 1.4%) Reading- 23.4% to 21.9% (decrease 1.5%) SWD: Math- 32.3% to 30.3% (decrease 2%) Reading- 35.4% to 33.2% (decrease 2.2%)
2012-2014 TCAP REPORTING CATEGORIES COMPARISON6th Grade RLA P/A • 6th Grade Math
7th Grade RLA 7th Grade Math
8th Grade RLA 8th Grade Math
Overview of Achievement… • Achievement trends show higher than state percentages P/A. • Trends showing some decreases in percentages of P/A from previous year testing. • Proficiency level for ED subgroup show strong gains in RLA. (+5.4%) • Decrease in BHN subgroup percent P/A in RLA highest in H. (-16.1%) • SWD subgroup our biggest challenge.
GROWTH DATA OCOEE MIDDLE SPRING 2014 TCAP
Strengths & Challenges Math • 6th grade, 7th grade, 8th grade RLA • 6th grade, 7th grade, 8th grade Science • 6th grade, 7th grade, 8th grade Social Studies • 6th grade, 7th grade, 8th grade
Needs Assessment… OMS School Improvement Plan Prioritized List of Needs SWD Achievement Gaps & 6th grade Growth SIP Leadership Committee: 7th: S. Green, J. Holland, A. Jordan 8th: N. Carver, J. Morris 6th: J. McGuire, A. Morris, E. Policastro K. Covington, B. Ledford, R. Spangler
Teacher Effectiveness Report • TVAAS login directions: • https://tvaas.sas.com/evass/signin • User name: First name (period .) Last name • Password: If you do not have it, click ‘forgot password’ and they should ask for email to send you another. • When you get Password entered, you click REPORTS, under TEACHER REFLECTION choose ‘Teacher Report’. • *When you enter your License Number—only the last 6 digits.Be sure to click ‘accept’ box before submit. • If you need help understanding report, on the TVAAS home page top bar click ‘Help’, choose ‘Learning Modules’. You will see a long list of several topics. Find Teacher Report – TCAP.
Teacher Data... • Teachers with individual growth scores • 50 percent of the evaluation to be comprised of student achievement data— • 35 percent based on student growth as represented by the Tennessee Value-Added Assessment System (TVAAS) or a comparable measure • 15 percent based on additional measures of student achievement adopted by the State Board of Education and chosen through mutual agreement by the educator and evaluator. • 50 percent of the evaluation is determined through qualitative measures such as teacher observations, student perception surveys, personal conferences, and review of prior evaluations and work.
Teacher Data… • Teachers without individual growth scores • 40 percent of the evaluation to be comprised of student achievement data— • 25 percent based on school-wide or system-wide student growth as represented by the Tennessee Value-Added Assessment System (TVAAS) • 15 percent based on additional measures of student achievement adopted by the State Board of Education and chosen through mutual agreement by the educator and evaluator. • 60 percent of the evaluation is determined through qualitative measures such as teacher observations, student perception surveys, personal conferences, and review of prior evaluations and work.
COLTS - Considering Others while Learning Together Successfully… OMS has a lot of celebrations concerning data! Challenges we will face together! “We are ALL IN….”