Download
1 / 22
220 likes | 228 Vues
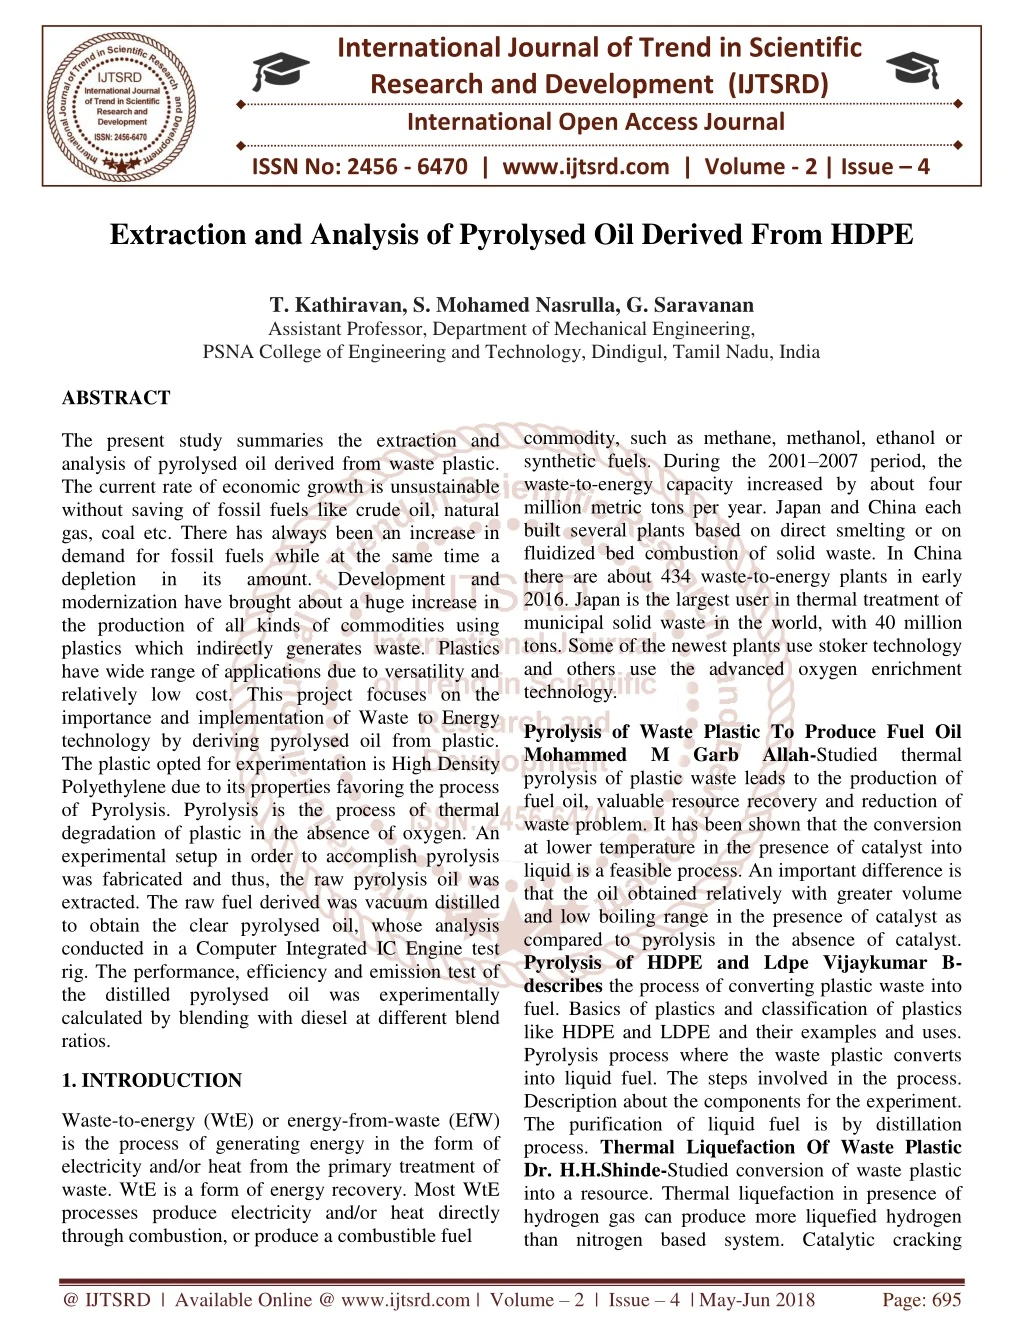
The present study summaries the extraction and analysis of pyrolysed oil derived from waste plastic. The current rate of economic growth is unsustainable without saving of fossil fuels like crude oil, natural gas, coal etc. There has always been an increase in demand for fossil fuels while at the same time a depletion in its amount. Development and modernization have brought about a huge increase in the production of all kinds of commodities using plastics which indirectly generates waste. Plastics have wide range of applications due to versatility and relatively low cost. This project focuses on the importance and implementation of Waste to Energy technology by deriving pyrolysed oil from plastic. The plastic opted for experimentation is High Density Polyethylene due to its properties favoring the process of Pyrolysis. Pyrolysis is the process of thermal degradation of plastic in the absence of oxygen. An experimental setup in order to accomplish pyrolysis was fabricated and thus, the raw pyrolysis oil was extracted. The raw fuel derived was vacuum distilled to obtain the clear pyrolysed oil, whose analysis conducted in a Computer Integrated IC Engine test rig. The performance, efficiency and emission test of the distilled pyrolysed oil was experimentally calculated by blending with diesel at different blend ratios. T. Kathiravan | S. Mohamed Nasrulla | G. Saravanan "Extraction and Analysis of Pyrolysed Oil Derived From HDPE" Published in International Journal of Trend in Scientific Research and Development (ijtsrd), ISSN: 2456-6470, Volume-2 | Issue-4 , June 2018, URL: https://www.ijtsrd.com/papers/ijtsrd13046.pdf Paper URL: http://www.ijtsrd.com/engineering/mechanical-engineering/13046/extraction-and-analysis-of-pyrolysed-oil-derived-from-hdpe/t-kathiravan<br>

E N D
International Journal of Trend in Scientific Research and Development (IJTSRD) International Open Access Journal ISSN No: 2456 - 6470 | www.ijtsrd.com | Volume - 2 | Issue – 4 Extraction and Analysis of Pyrolysed Oil Derived From HDPE T. Kathiravan, S. Mohamed Nasrulla, G. Saravanan Assistant Professor, Department of Mechanical Engineering, PSNA College of Engineering and Technology, Dindigul, Tamil Nadu, India ABSTRACT The present study summaries the extraction and analysis of pyrolysed oil derived from waste plastic. The current rate of economic growth is unsustainable without saving of fossil fuels like crude oil, natural gas, coal etc. There has always been an increase in demand for fossil fuels while at the same time a depletion in its amount. modernization have brought about a huge increase in the production of all kinds of commodities using plastics which indirectly generates waste. Plastics have wide range of applications due to versatility and relatively low cost. This project focuses on the importance and implementation of Waste to Energy technology by deriving pyrolysed oil from plastic. The plastic opted for experimentation is High Density Polyethylene due to its properties favoring the process of Pyrolysis. Pyrolysis is the process of thermal degradation of plastic in the absence of oxygen. An experimental setup in order to accomplish pyrolysis was fabricated and thus, the raw pyrolysis oil was extracted. The raw fuel derived was vacuum distilled to obtain the clear pyrolysed oil, whose analysis conducted in a Computer Integrated IC Engine test rig. The performance, efficiency and emission test of the distilled pyrolysed oil was experimentally calculated by blending with diesel at different blend ratios. commodity, such as methane, methanol, ethanol or synthetic fuels. During the 2001–2007 period, the waste-to-energy capacity increased by about four million metric tons per year. Japan and China each built several plants based on direct smelting or on fluidized bed combustion of solid waste. In China there are about 434 waste-to-energy plants in early 2016. Japan is the largest user in thermal treatment of municipal solid waste in the world, with 40 million tons. Some of the newest plants use stoker technology and others use the advanced oxygen enrichment technology. Development and Pyrolysis of Waste Plastic To Produce Fuel Oil Mohammed M Garb pyrolysis of plastic waste leads to the production of fuel oil, valuable resource recovery and reduction of waste problem. It has been shown that the conversion at lower temperature in the presence of catalyst into liquid is a feasible process. An important difference is that the oil obtained relatively with greater volume and low boiling range in the presence of catalyst as compared to pyrolysis in the absence of catalyst. Pyrolysis of HDPE and Ldpe Vijaykumar B- describes the process of converting plastic waste into fuel. Basics of plastics and classification of plastics like HDPE and LDPE and their examples and uses. Pyrolysis process where the waste plastic converts into liquid fuel. The steps involved in the process. Description about the components for the experiment. The purification of liquid fuel is by distillation process. Thermal Liquefaction Of Waste Plastic Dr. H.H.Shinde-Studied conversion of waste plastic into a resource. Thermal liquefaction in presence of hydrogen gas can produce more liquefied hydrogen than nitrogen based system. Catalytic cracking Allah-Studied thermal 1. INTRODUCTION Waste-to-energy (WtE) or energy-from-waste (EfW) is the process of generating energy in the form of electricity and/or heat from the primary treatment of waste. WtE is a form of energy recovery. Most WtE processes produce electricity and/or heat directly through combustion, or produce a combustible fuel @ IJTSRD | Available Online @ www.ijtsrd.com | Volume – 2 | Issue – 4 | May-Jun 2018 Page: 695
International Journal of Trend in Scientific Research and Development (IJTSRD) ISSN: 2456-6470 2. PYROLYSIS SELECTION OF MATERIAL FOR followed by thermal liquefaction can facilitate effective conversion of waste plastic into liquid fuel. Thermo catalytic process is having potential or effective conversion of waste plastic to fuel. Synthesis of Pyrolysed Oil from Plastic Kanika Mathur-describes an attempt to use waste plastic to synthesize potential fuel called pyrolysis oil. Since the process used in order to obtain the oil is pyrolysis. The obtained oil from different grades of waste plastic is analysed so as to 696validate its use as fuel. Vacuum Distillation of Pyrolysed Oil Songhai Wiriyoumpaiwong-In this paper, distillation of pyrolysis oil obtained from fast pyrolysis of plastic wastes. Fractional distillation is commonly used to separate the petroleum oils. The distillation had a lighter colour than the pyro lytic oil samples. The distillation was light yellowish in colour. The distilled product from the pyro lytic oil from plastic waste has potential to be used as gasoline replacement fuel. Catalytic Pyrolysis of HDPE Yb Sonawane-In this paper, onsite conversion of thermoplastic waste into fuel by catalytic pyrolysis. Pyrolysis of high density polyethylene waste in the form of carry bags was carried out in an in-house fabricated glass reactor. The maximum temperature in reactor was kept about 550ºc. Reaction was carried out with and without using catalysts. It was found that time required for completion of the pyrolysis process was 3.5hrs without catalyst and 2.5hrs with catalyst. Design And Fabrication Of Pyrolysis Reactor Manjunath S- Studied pyrolysis of waste plastic into fuel. Design and fabrication of a pyrolysis reactor caco3 can be used as a catalyst to crack LDPE plastic. The waste LDPE plastic was chosen because of its low melting point of 98-115ºc. The fuel obtained was subjected to atmospheric distillation. Degradation of Plastic in Glass Reactor Thallada Bhaskar-In this paper, the degradation process is carried out in a glass reactor. The caco3 sorbent completely removed the chlorine content and produced halogen free liquid products. The presence of water in the plastic mixture did not affect the characteristics of liquid products. PVC produces hydrochloric acid which leads to formation of halogenated hydrocarbons in liquid products. So there are not suitable to use as a fuel oil in refinery. Modelling of Batch Gasification Pyrolysis Reactor P. Baggio-In this paper experimental and modelling analysis of a batch gasification/pyrolysis reactor. An experiment bench scale apparatus for biomass gasification and pyrolysis has been designed. HDPE is known for its large strength to density ratio. The density of HDPE can range from 0.93 to 0.97 g/cm3 or 970 kg/m3. Although the density of HDPE is only marginally higher than that of low-density polyethylene, HDPE has little branching, giving it stronger intermolecular forces and tensile strength than LDPE. The difference in strength exceeds the difference in density, giving HDPE a higher specific strength. It is also harder and more opaque and can withstand somewhat higher temperatures (120 °C/ 248 °F for short periods). High-density polyethylene, unlike polypropylene, cannot withstand normally required autoclaving conditions. The lack of branching is ensured by an appropriate choice of catalyst (e.g., Ziegler-Natta catalysts) and reaction conditions High-density polyethylene, unlike polypropylene, cannot withstand normally required autoclaving conditions. The lack of branching is ensured by an appropriate choice of catalyst (e.g., Ziegler-Natta catalysts) and reaction conditions. The physical properties of HDPE can vary depending on the moulding process that is used to manufacture a specific sample; to some degree a determining factor are the international standardized testing methods employed to identify these properties for a specific process. For example, in Rotational Moulding, to identify the environmental stress crack resistance of a sample the Notched Constant Tensile Load Test (NCTL) is put to use. Owing to these desirable properties, pipes constructed out of HDPE are ideally applicable for potable water, and waste water (storm and sewage) force mains across multiple municipalities, namely Toronto Water. 2.1 APPLICATIONS OF HDPE HDPE is used for cell liners in subtitle D sanitary landfills, wherein large sheets of HDPE are either extrusion or wedge welded to form a homogeneous chemical-Resistant barrier, with the intention of preventing the pollution of soil and groundwater by the liquid constituents of solid waste. HDPE is preferred by the pyrotechnics trade for mortars over steel or PVC tubes, being more durable and safer. HDPE tends to rip or tear in a malfunction instead of shattering and becoming shrapnel like the other materials. Milk jugs and other hollow goods manufactured through blow moulding are the most @ IJTSRD | Available Online @ www.ijtsrd.com | Volume – 2 | Issue – 4 | May-Jun 2018 Page: 696
International Journal of Trend in Scientific Research and Development (IJTSRD) ISSN: 2456-6470 important application area for HDPE, accounting for one-third of worldwide production, or more than 8 million tonnes. From the below tables it is clear that it’s HDPE which has the highest tensile strength. This energy could be released while pyrolysis and the oil would have high calorific value. Table 2.1 Physical properties of various plastics Melting Point (̊C) Tensile Strength (PSI) Water Absorption (%) Name Density (g/cm3) HDPE LDPE PP PS 0.95 0.92 0.94 1.05 130 120 160 240 4500 1700 5000 6671-8702 0.01 0.01 0.01-0.03 0.03-0.1 Also it is clear that the melting point of HDPE is not that high so could easily be melted to form the liquid state. The water absorption rate of HDPE is low. Thus there is no need of high temperature to vaporise the water content away from it. Out of the whole type of plastics those which are suitable are polyethylene [PE], polypropylene [PP], polystyrene [PS]. and heated by means of electrical energy. The yield commenced at a temperature of 350℃. The gaseous products resulting from the pyrolysis of the plastic wastes is supplied to the catalyst of Potassium permanganate. Then the burned plastic gas condensed in a water cooled condenser to liquid fuel and collected for experiments. The steps are given below: 1.Identification (PE/PP/PS/LDPE/HDPE/ABS) of waste plastics. 3. Extraction of Pyrolysed Oil from HDPE 3.1 Methodology 2.Subjecting the waste plastic for pyrolysis process. 3.Condensation of the gas to obtain liquid fuel. In our experiments, commercially available shredded plastics were procured and washed before pyrolysis. One of the most favorable and effective disposing method is pyrolysis, which is environmental friendly and efficient way. Pyrolysis is the thermal degradation of solid wastes at high temperatures (300- 900℃) in the absence of air (and oxygen). As the structure of products and their yields can be considerably modified by catalysts, results of pyrolysis in the absence of catalyst were presented in this article Pyrolysis of waste plastics was carried out in an indigenously designed and fabricated reactor. Shows the scheme of the process involved in the experiments and the photograph of the experimental set up respectively. Waste plastics had been procured form the commercial source and stored in a raw material storage unit. Raw material was then fed in the reactor 4.Conversion of liquid fuel into its pure form (diesel etc.) by the process of distillation. 3.1.1 Collection & Identification of Waste Plastic The collection of waste plastic is quite an easy task as compared to other wastes, the plastic wastes are abundant and can be obtained in large quantities from the households, roadsides, hospitals, hotels etc. Usually they are manufactured in the form of plastic bags, saline bottles, plastic tools, chairs and other components which we usually come across in our day to day life. These plastics could be collected or usually purchased at Rs.10 to 15/kg after being shredded and washed properly. @ IJTSRD | Available Online @ www.ijtsrd.com | Volume – 2 | Issue – 4 | May-Jun 2018 Page: 697
International Journal of Trend in Scientific Research and Development (IJTSRD) ISSN: 2456-6470 3.1.2 Subjecting the Waste Plastic for Pyrolysis Process Fig 3.1: block diagram of pyrolysis process The pyrolysis is a simple process in which the organic matter is subjected to higher temperature about 300ºC to 500ºC in order to promote thermal cracking of the organic matter so as to obtain the end products in the form of – liquid, char and gas in absence of oxygen. 3.1.3 CONDENSATION OF GAS TO OBTAIN RAW FUEL After heating the waste plastic at a temperature of about 300 ºC to 500ºC in the reactor the gas is allowed to escape through the outlet dipped into the water containing jar so as to condense the fumes to obtain the liquid fuel floating over the surface, Which is further taken out through the outlet provide to the water containing jar. 3.1.4. CONVERSION OF LIQUID FUEL INTO ITS PURE FORM BY THE PROCESS OF DISTILLATION Once the liquid fuel is obtained it is further subjected to distillation process so as to obtain the fuel i.e. diesel in its pure form by removing the impurities present in it which can be then tested into diesel engines for its efficiency. Here we used vacuum distillation process. Vacuum distillation is a method of distillation whereby the pressure above the liquid mixture to be distilled is reduced to less than its vapour pressure (usually less than atmospheric pressure) causing evaporation of the volatile liquid. This distillation method works on the principle that boiling occurs when the vapor pressure of a liquid exceeds the ambient pressure. Vacuum distillation is used with or without heating the mixture. Fig 3.2: Distillation process Pyrolysis is a thermochemical decomposition of organic material at elevated temperatures in the absence of oxygen (or any halogen). It involves the simultaneous change of chemical composition and physical phase, and is irreversible. The word is coined from the Greek-derived elements pyro “fire" and lysis "separating". @ IJTSRD | Available Online @ www.ijtsrd.com | Volume – 2 | Issue – 4 | May-Jun 2018 Page: 698
International Journal of Trend in Scientific Research and Development (IJTSRD) ISSN: 2456-6470 Fig 3.3 Molecular structure of pyrolysis oil other high-temperature Pyrolysis processes like combustion and hydrolysis in that it usually does not involve reactions with oxygen, water, or any other reagents. In practice, it is not possible to achieve a completely oxygen- free atmosphere. Because some oxygen is present in any pyrolysis system, a small amount of oxidation occurs. Bio-oil is produced via pyrolysis, a process in which biomass is rapidly heated to 450–500°C in an oxygen-free environment and then quenched, yielding a mix of 3.3 DESCRIPTION OF COMPONENTS differs from liquid fuel (pyrolysis oil), gases, and solid char. Variations in the pyrolysis method, biomass characteristics, and reaction specifications will produce varying percentages of these three products. Several technologies and methodologies can be used for pyrolysis, including circulating fluid beds, entrained flow reactors, multiple hearth reactors, or vortex reactors. The process can be performed with or without a catalyst. Fig 3.4 Experimental setup @ IJTSRD | Available Online @ www.ijtsrd.com | Volume – 2 | Issue – 4 | May-Jun 2018 Page: 699
International Journal of Trend in Scientific Research and Development (IJTSRD) ISSN: 2456-6470 3.3.1 COMBUSTION CHAMBER latent heat to surroundings for transferring from gaseous to liquid state. Diameter of the copper wire =12mm No: of coils in condenser 3.3.3 ELECTRICAL HEATING COIL A heating coil transforms electricity into heat through the process of resistive or Joule heating. Electric current passing through the conductor experiences resistance resulting in heating of the element. Metallic heating element may be ribbon or wire, straight or coiled in nature. They are commonly used in toasters, hair dryers, furnaces for heating purpose, floor heating etc. The electrical heating element currently selected is wired type. The heating coil which is selected now is made up of Nichrome. The selected alloy contains 80% nickel and 20% chromium. Nichrome is selected because of its high resistive properties. The higher resistance offers efficient heating. Power of heater=2000watts 3.4 WORKING The plastic selected specifically HDPE is fed to the chamber. The plastic is fed to the chamber through the lid at the top of the chamber. The lid of the chamber is properly bolted once the plastic is fed into the chamber. About 5kg of plastic is fed once to the chamber. Then the electrical heating coil wound around the chamber is switched on. This coil supplies enough heat to melt the plastic fed into the chamber. Continuous melting leads to formation of liquid melted plastic. Further heating of the melted plastic leads to the formation of gaseous fumes. This fumes escapes out of the chamber to accumulate in the copper tube. Water is poured around the copper tube for condenser setup. Enough time is provided to let the gas accumulate in the copper tube by closing the valve at the end of the condenser setup. The water around the copper tube cools the fumes in it. The first signs of raw fuel comes after 20 minutes of continuous power supply. The gate valve is opened once in every 5 minutes. Each time when the valve is opened about 20 ml to 30 ml of raw fuel is collected. This raw fuel is to be distilled. 5. Performance Analysis of Distilled Oil in Computer Interfaced IC Engine Test Rig =5 Fig 3.5 Combustion chamber Combustion chamber is a cast iron chamber meant to melt the plastic fed into it. The combustion chamber should sustain all the heat fed to it without any cracking. The heating is provided with heating coil. The vessel is cylindrical with a lid to feed the plastic to it. The lid at the top is bolted to the chamber. This is the chamber in which the actual process of pyrolysis occurs. Height of the chamber =390mm Diameter of the chamber =300mm Height of the cylinder from ground =300mm No: of bolts at the top of the chamber =16 3.3.2 CONDENSER Fig 3.6 Condenser The condenser is made of copper tube. The fumes coming out of the chamber is to be condensed to obtain the raw pyrolysed fuel. The copper tube is encapsulated with water to form the required condenser. The copper tube with water form the heat exchanger. This heat exchanger effectively functions as a condenser. In systems involving heat transfer a condenser is a device that is used to condense a substance from its gaseous state to liquid state by cooling. The substance that gets cooled releases its @ IJTSRD | Available Online @ www.ijtsrd.com | Volume – 2 | Issue – 4 | May-Jun 2018 Page: 700
International Journal of Trend in Scientific Research and Development (IJTSRD) ISSN: 2456-6470 The distilled oil is tested for its performance, efficiencies and emissions. The oil blended with diesel in two different compositions are made to run in a Computer interfaced IC engine test rig. First the oil is blended with diesel and made up to 1litre performance and emission testing. The 25mL oil blend is termed as B2.5 and 50mL blend is termed as B5. Fig 5.2 Distilled oil Fig 5.3 Blend oil 5.2.1Performance and Emission Test of Distilled Oil Pure 1L of diesel is made to run in the IC engine for 10 min. The engine is made to run continuously for about 10 min at a load of 0V, the manomatric reading, current, crank speed and the various gaseous emission are tested. The same experimental procedure is repeated for loads of 500V, 1000V, of diesel. The same procedure is repeated for the 2diffirent blends B2.5 and B5 prepared. Thus the performance and emission of the blend fuel could be calculated. Fig 5.1 Computer interfaced IC engine test rig 5.1 Blending Of Pyrolysed Oil with Diesel Blending is the process of mixing different ingredients smoothly and inseparably to obtain a particular kind of quality. In our project, we blend our pyrolysed oil with diesel. Two different compositions are made by blending. First a mixture of 25mL pyrolysed oil with 975mL of diesel is made to make a blend of 1L. Again a mixture of 50mL pyrolysed oil with 950mL of diesel is made to make a blend of 1L. Once the blends are prepared, it’s ready for 6. RESULTS AND INFERENCES 6.1PERFORMANCE CHARACTERISTICS OF DIESEL Table 6.1(a) Performance characteristics of diesel Voltage (V) Speed (rpm) S.NO Electrical Load (kW) Fuel Consumption Manometric current (A) 0 2 3.9 5.9 9 Reading h1 (cm) h2 (cm) 70 70 70 70 70 1 2 3 4 5 0.5 1 1.5 2 2.5 220 220 220 220 220 1570 1528 1516 1502 1486 65 58 49 43 37 92 91 91 91 91 Table 6.1(b) Performance characteristics of diesel BP TIME TFC SFC FP ɳBTE IP ɳmech BMEP IMEP ɳITE 0 0.5 58 65 0.46 0.534 - 1.068 5.81 6.75 - 7.40 1.75 2.25 - 22.25 0 148 521 670 30.12 33.33 1 49.11 0.608 0.608 7.68 13.01 2.75 36.36 306 841 35.31 @ IJTSRD | Available Online @ www.ijtsrd.com | Volume – 2 | Issue – 4 | May-Jun 2018 Page: 701
International Journal of Trend in Scientific Research and Development (IJTSRD) ISSN: 2456-6470 1.5 43.46 0.688 0.451 8.7 17.25 3.25 46.15 462 1001 37.4 2 37.40 0.799 0.40 10.1 19.81 3.75 53.33 623 1167 37.2 Reading No: 2 1.Total fuel consumption, (TFC) = (10/t)* γ *(36/10) kg/hr 2.Specific fuel consumption = (10/58)*0.84*(36/10) = 0.534 = TFC/BP kg/kWhr = 0.534/0.5 = 1.068 kg/kWhr 3.Brake thermal efficiency (ɳBTE) = BP/fuel power = 0.5/fuel power Fuel power = (TFC*Cv)/3600 kW = (0.534*45500)/3600 = 6.749 kW Brake thermal efficiency (ɳBTE) Area of orifice = 0.5/6.749 = 7.40% = (π*d2)/4 = (π*0.07)/4 = 0.00385 m2 Fig 6.1 Brake power vs SFC (From this graph the frictional power is taken as FB = 1.75kW) 4.Indicated power (IP) = BP+FP =0.5+1.75 =2.25kW 5.Mechanical efficiency (ɳmech) = BP/IP = 0.5/2.25 = 22.25% 6.Indicated thermal efficiency, (ɳITE) =Indicated power/ fuel power =2.25/6.749 =33.3% 7.Brake mean effective pressure, (BMEP) = (BP*2*60)/LAN = {(0.5*2*60)}/{(0.0667*0.00385*1528)} = 148.82 kN/m2 8.Indicated mean effective pressure, (IMEP) = (IP*2*60)/LAN = {(2.25*2*60)}/ @ IJTSRD | Available Online @ www.ijtsrd.com | Volume – 2 | Issue – 4 | May-Jun 2018 Page: 702
International Journal of Trend in Scientific Research and Development (IJTSRD) ISSN: 2456-6470 {(0.0667*0.00385*1528)} = 669.69 kN/m2 6.2 PERFORMANCE CHARACTERISTICS OF B5 BLEND Table 6.2 (a) Performance characteristics of B5 blend S.NO (V) CAM SPEED (rpm) TIME FOR 10CC CONSUMPTION (s) MANOMETRIC READING h1 (cm) (cm) 70 LOAD CRANK h2 Hm (m) 0.795 1 0 768 1536 51 89 2 500 765 1530 53 72 89.5 0.8075 3 1000 756 1512 50.83 72 89.5 0.8075 4 1500 750 1500 43.07 72 89.5 0.8075 5 2000 745 1490 38.68 74 88 0.81 Table 6.2 (b) Performance characteristics of B5 blend BP (kW) (kg/hr) (kg/kWhr) S.No TFC SFC FP (kW) MA (kg/hr) MF (kg/hr) A/F 1 0 0.5929 0 1.95 23.4 30.42 39.46 2 0.5 0.5705 1.141 1.95 20.2 30.12 35.4 3 1 0.5949 0.5949 1.95 18.9 29.8 31.77 4 1.5 0.7021 0.4680 1.95 18.1 29.3 25.77 5 2 0.7817 0.3908 1.95 16.7 28.1 21.363 Table 6.2 (c) Performance characteristics of b5 blend ɳme ch (%) (%) 1.95 0 0 Fuel Power (FP) IP BMEP (kN/? ?2) IMEP (kN/? ?2) ɳBT E ɳIT E (%) 26.03 S.No (kW) 7.49 0 593.2 1 2 2.45 20.4 6.93 33.98 7.21 152.7 757.19 3 2.95 33.8 13.29 39.38 7.49 309 911.7 4 3.45 43.4 16.90 38.89 8.87 467.2 1074.7 5 3.95 50.6 20.24 40.02 9.87 627.2 1238.8 READING NO: 2 1.Total fuel consumption = (10/t)* γ *(3600/1000) kg/hr = (10/53)*0.84*(3600/1000) = 0.5705 kg/hr 2.Specific fuel consumption = TFC/BP kg/kWhr @ IJTSRD | Available Online @ www.ijtsrd.com | Volume – 2 | Issue – 4 | May-Jun 2018 Page: 703
International Journal of Trend in Scientific Research and Development (IJTSRD) ISSN: 2456-6470 = 0.5705/0.5 = 1.141 kg/kWhr 3.Actual mass of air, (ma) = cd*ρa*A*(2gha)1/2*3600 = {0.62*1.23*1.227*10-4 *(2*9.81*0.1842)1/2*3600} = 20.2 kg/hr = πd2/4*L(N/2)ρa*60 kg/hr = π (0.08)2/4*0.11*(1530/2)*1.23*60 4.Theoretical mass of air, (mf ) = 30.12 kg/hr 5.Air fuel ratio, (A/F) = actual air intake/TFC = 20.2/0.5705 = 35.4 6.Indicated power (IP) 7.Mechanical efficiency (ɳmech) 8.Brake thermal efficiency (ɳBTE) = BP+FP= 0.5+1.95 = 2.45kW = BP/IP = 0.5/2.45 = 20.4% = BP/fuel power = 0.5/fuel power 9.Fuel power = (TFC*CV)/3600 = (0.5705*45500)/3600 = 7.21 kW Brake thermal efficiency, (ɳBTE) = 0.5/7.21= 6.93% Indicated thermal efficiency, (ɳITE) = Indicated power/ fuel power =2.45/7.21 =33.98% 10.Brake mean effective pressure, (BMEP) = (BP*2*60)/LAN = {(0.5*2*60)}/ {(0.0667*0.00385*1530)} = 152.7 kN/m2 11.Indicated mean effective pressure, (IMEP) = (IP*2*60)/LAN = {(2.5*2*60)}/ {(0.0667*0.00385*1530 = 757.19 kN/m2 6.2PERFORMANCE CHARACTERISTICS OF B2.5 BLEND Table6.3 (a) Performance characteristics of B2.5 blend SPEED (rpm) FUEL MANOMETRIC READING BP (W) CONSUMPTION TIME FOR 10CC (s) CURRENT (A) S.NO CAM CRANK h1 (cm) h2 (cm) hm (m) @ IJTSRD | Available Online @ www.ijtsrd.com | Volume – 2 | Issue – 4 | May-Jun 2018 Page: 704
International Journal of Trend in Scientific Research and Development (IJTSRD) ISSN: 2456-6470 1 0 770 1540 104 0 76 88.8 0.824 2 500 761 1522 59 198 76 88.9 0.824 3 1000 756 1512 50.8 399 74.8 88.9 0.8185 4 1500 750 1500 43.79 602 74.4 88.5 0.8145 5 2000 745 1490 38.56 810 73.2 88.5 0.8085 Table6.3 (b) Performance characteristics of B2.5 blend IP FUEL POWER (FP) 3.67 BMEP (kN/? ?2) IMEP (kN/? ?2) S.NO (kW) ɳmech ɳBTE ɳITE 1 1.8 0 0 49.04 0 546.19 2 2.3 21.73 7.72 35.5 6.47 153.51 706.16 3 2.8 35.71 13.29 37.23 7.52 309.06 865.36 4 3.3 45.45 17.2 37.84 8.72 467.29 1028.05 5 3.8 52.6 20.18 38.34 9.91 627.24 1191.76 Table6.3 (c) Performance characteristics of B2.5 blend S.NO BP (kW) TFC (kg/hr) SFC FP (kW) Ma (kg/hr) Mf A/F (kg/kWhr) (kg/hr) 1 0 0.2907 0 1.8 20.81 21.46 71.58 2 0.5 0.5125 1.025 1.8 18.12 19.31 35.35 3 1 0.5952 0.5952 1.8 16.43 16.92 27.6 4 1.5 0.6905 0.4603 1.8 14.32 16.1 20.73 5 2 0.7842 0.3921 1.8 12.18 14.21 15.53 READING NO: 2 1.Total fuel consumption = (10/t)* γ *(3600/1000) kg/hr = (10/0.84)*(3600/1000) = 0.5125 kg/hr 2.Specific fuel consumption = TFC/BP kg/kWhr = 0.5125/0.5 = 1.025 kg/kWhr = cd*ρa*A*(2gha)1/2*3600 = {0.62*1.23*1.227*104}* 3.Actual mass of air, (ma) {(2*9.81*161.51)1/2*3600} = 18.12 kg/hr @ IJTSRD | Available Online @ www.ijtsrd.com | Volume – 2 | Issue – 4 | May-Jun 2018 Page: 705
International Journal of Trend in Scientific Research and Development (IJTSRD) ISSN: 2456-6470 = πd2/4*L(N/2)ρa*60 kg/hr = π (0.08)2/4*0.11*(1522/2)*1.23*60 4.Theoretical mass of air, (mf ) = 19.31 kg/hr 5.Air fuel ratio, (A/F) = actual air intake/TFC = 18.12/0.5125= 35.35 6.Indicated power (IP) 7.Mechanical efficiency (ɳmech) 8.Brake thermal efficiency (ɳBTE) Fuel power = BP+FP =0.5+1.8 =2.3kW = BP/IP = 0.5/2.3 = 21.73% = BP/fuel power = 0.5/fuel power = (TFC*CV)/3600 kW = (0.5125*45500)/3600 = 6.47 kW Brake thermal efficiency (ɳBTE) =0.5/6.47 = 7.72% 9.Indicated thermal efficiency, (ɳITE) = Indicated power/ fuel power =2.3/7.21=35.5% 10.Brake mean effective pressure, (BMEP)= (BP*2*60)/LAN = {(0.5*2*60)}/ {(0.0667*0.00385*1522)} = 153.51 kN/m2 11.Indi. mean effective pressure, (IMEP) = (IP*2*60)/LAN = {(2.3*2*60)}/{(0.0667*0.00385*1522)} = 706.16 kN/m2 6.3COMPARISON OF PERFORMANCE BETWEEN DIESEL AND B5 BLEND 6.3.1SPECIFIC FUEL CONSUMPTION From the graph it’s very clear that the SFC value of B5 blend matches well with that of diesel. It’s also clear that the SFC value of pyrolysed oil is a little less than that of pure diesel. SFC Fig 6.2 Specific fuel consumption vs BP @ IJTSRD | Available Online @ www.ijtsrd.com | Volume – 2 | Issue – 4 | May-Jun 2018 Page: 706
International Journal of Trend in Scientific Research and Development (IJTSRD) ISSN: 2456-6470 6.3.2MECHANICAL EFFICIENCY Fig 6.3 Mechanical efficiency vs BP Mechanical efficiency of both the fuels increase with increase in load and both shows similar pattern of response to load variation. Also the mechanical efficiency of the blend is a little less than that of diesel. 6.3.3 BRAKE THERMAL EFFICIENCY From the graph it’s clear that both fuels show an increase in brake thermal efficiency with increase in load value. For BP values of 1 and 2 the efficiency of blend is a little higher than that of diesel while for the other two values efficiency of diesel is higher. ɳmech Fig 6.4 Brake thermal efficiency vs. brake power 6.3.4INDICATED THERMAL EFFICIENCY From the graph it’s clear that the indicated thermal efficiency of the blend shows a sudden increase in its value with increasing value of BP. The efficiency value of the blend matches well with that of diesel for first 2 values of BP and for further increasing values of BP the efficiency of the blend is higher. @ IJTSRD | Available Online @ www.ijtsrd.com | Volume – 2 | Issue – 4 | May-Jun 2018 Page: 707
International Journal of Trend in Scientific Research and Development (IJTSRD) ISSN: 2456-6470 Fig 6.5 Indicated thermal efficiency vs. brake power 6.3.5BRAKE MEAN EFFECTIVE PRESSURE EP Fig 6.6 Brake mean effective pressure vs. brake power Brake Mean Effective Pressure (BMEP) is another very effective yardstick for comparing the performance of an engine of a given type to another of the same type, and for evaluating the reasonableness of performance claims or requirements. The average (mean) pressure which, if imposed on the pistons uniformly from the top to the bottom of each power stroke, would produce the measured (brake) power output. BMEP is purely theoretical and has nothing to do with actual cylinder pressures. It is simply a tool to evaluate the efficiency of a given engine at producing torque from a given displacement. The graph shows the variation between BP and BMEP. The value of BMEP for both the fuels increases with increasing BP. Also both the fuels show close tolerances in their values. 6.3.6INDICATED MEAN EFFECTIVE PRESSURE @ IJTSRD | Available Online @ www.ijtsrd.com | Volume – 2 | Issue – 4 | May-Jun 2018 Page: 708
International Journal of Trend in Scientific Research and Development (IJTSRD) ISSN: 2456-6470 Fig 6.7 Indicated mean effective pressure vs brake power Indicated Mean Effective Pressure (IMEP) is a fictitious pressure, such that if it acts during whole cycle, it would produce the same amount of work. The IMEP value of both the fuels increases with increase in BP. Here from the graph it’s clear that the value of blend is higher than that of diesel. 6.5COMPARISON OF PERFORMANCE BETWEEN DIESEL AND B2.5 BLEND 6.5.1.SPECIFIC FUEL CONSUMPTION SFC Fig 6.8 Specific fuel consumption vs. brake power From the graph it’s very clear that the value of SFC increases with increasing value of BP. Also the value of SFC for blend is lesser compared to diesel. @ IJTSRD | Available Online @ www.ijtsrd.com | Volume – 2 | Issue – 4 | May-Jun 2018 Page: 709
International Journal of Trend in Scientific Research and Development (IJTSRD) ISSN: 2456-6470 6.5.2.MECHANICAL EFFICIENCY Fig 6.9 Mechanical efficiency vs brake power From the graph it’s clear that the trend of increment in mechanical efficiency for both the fuels are similar. Also the efficiency value of diesel is higher than that of the blend. 6.5.3.BRAKE THERMAL EFFICIENCY ᶯBTE vs BP 2 1.5 1 0.5 0 Fig 6.10Brake thermal efficiency vs brake power The value of brake thermal efficiency of both fuels increases with increase in load value. Also graph shows that the efficiency value of blend is a little higher. 6.5.4.INDICATED THERMAL EFFICIENCY From the graph it’s clear that the value of indicated thermal efficiency increases with increase in load value. From the graph we can infer that the value of efficiency for the first load of blend was very much higher than that of diesel. For further increase in value of BP, both the fuels show the same pattern. It’s also clear from the graph that the value of efficiency for the blend is higher than that of diesel. @ IJTSRD | Available Online @ www.ijtsrd.com | Volume – 2 | Issue – 4 | May-Jun 2018 Page: 710
International Journal of Trend in Scientific Research and Development (IJTSRD) ISSN: 2456-6470 Fig 6.11 Indicated thermal efficiency vs. brake power 6.5.5.BRAKE MEAN EFFECTIVE PRESSURE It is clear from the graph that the value for BMED for both B2.5 and diesel follow similar pattern and similar value as the load increases. BMEP VS BP 700 600 500 400 0 0.5 1.5 2 1 BP BMEP B2.5 BMEP DIESEL Fig 6.12 Brake mean effective pressure vs. brake power @ IJTSRD | Available Online @ www.ijtsrd.com | Volume – 2 | Issue – 4 | May-Jun 2018 Page: 711
International Journal of Trend in Scientific Research and Development (IJTSRD) ISSN: 2456-6470 6.5.6.INDICATED MEAN EFFECTIVE PRESSURE IMEP VS BP 1400 1200 IMEP 1000 IMEP B2.5 IMEP DIESEL 400 200 0 0.5 1 1.5 2 2.5 BP Fig 6.13 Indicated mean effective pressure vs. brake power From the above graph we can infer IMEP between B2.5 and pure diesel shows steady increase linearly as the load increases. IMEP value of B2.5 is marginally higher than the diesel value. 6.6.EMISSION CHARACTERSTIC OF B2.5 BLEND Table 6.4 Emission characteristic of B2.5 blend CO CO2 BP KW 0 HC O2 NOX % % Ppm 0319 % 1.04 0.032 7 18.66 0.5 0.030 0.98 10 18.77 0400 1 0.029 1.29 12 18.23 0666 1.5 0.027 1.11 13 18.09 0917 2 0.32 1.77 14 17.23 01303 6.7 EMISSION CHARACTERSTIC OF DIESEL Table 6.5 Emission characteristic of diesel CO % 0.023 1.65 BP KW 0 CO2 % HC ppm 15 O2 % 17.9 NOX Ppm 800 0.5 0.012 1.09 19 18 900 1 0.011 1.12 21 18.75 990 1.5 0.013 0.9 23 18.6 1070 2 0.010 1 27 18.48 1390 @ IJTSRD | Available Online @ www.ijtsrd.com | Volume – 2 | Issue – 4 | May-Jun 2018 Page: 712
International Journal of Trend in Scientific Research and Development (IJTSRD) ISSN: 2456-6470 6.8 EMISSION CHARACTERSTIC OF B5 BLEND Table 6.5 Emission characteristic of B5 blend BP CO % 0.03 CO2 % 1.12 Hc ppm 13 O2 % 17.99 NOX Ppm 0704 0 0.5 0.016 1.22 17 18.61 0509 1 0.015 1.14 20 18.54 0589 1.5 0.013 1.36 21 18.25 0954 2 0.012 1.85 27 17.72 1228 6.9COMPARISON OF EMISSION CHARACTERISTICS OF DIESEL WITH B2.5 AND B5 BLENDS 6.9.1Carbon monoxide Carbon monoxide is emitted as a result of incomplete combustion of carbon and oxygen under high temperature inside the cylinder. We can infer that B2.5 produce more CO compared to other two, whereas B5 blend have similar pattern like of diesel but in a slight higher scale. CO VS BP 0.04 0.03 0.02 0.01 0 0.5 1.5 2 1 BP CO B2.5 CO B5 CO DIESEL 6.1.1Carbon dioxide: Carbon dioxide comes as exhaust as a result of complete combustion of carbon particles in the fuel and the combustion of CO inside the cylinder. For all the three; diesel, B2.5 AND B5 the pattern for the emission CO2 is similar but the blends tend to show higher rate of emission compared to diesel, where B2.5 show more similar to the diesel. @ IJTSRD | Available Online @ www.ijtsrd.com | Volume – 2 | Issue – 4 | May-Jun 2018 Page: 713
International Journal of Trend in Scientific Research and Development (IJTSRD) ISSN: 2456-6470 Fig 6.15 Carbon dioxide vs. brake power 6.1.1Hydrocarbon (HC): Exhaust gases leaving the combustion chamber of an IC engine contains up to 100 ppm of hydrocarbon. These consist of small non equilibrium which is formed when large fuel molecules break up during the combustion reaction. It is often convenient to treat these molecules as if they contained carbon atom. It is seen that HC emissions increases up to a certain load then decreases for diesel. For both blends it shows increasing trend as the load increases. Under lower load conditions emission in case of diesel is more than that of B2.5 but at higher load. HC VS BP 3 0 2 5 2 0 0. 1. 2 1 HC B2.5 DIESEL HC B5 HC Fig 6.16 Hydrocarbon vs. brake power Conditions the B5 give more HC emissions than diesel which is shown in graph above @ IJTSRD | Available Online @ www.ijtsrd.com | Volume – 2 | Issue – 4 | May-Jun 2018 Page: 714
International Journal of Trend in Scientific Research and Development (IJTSRD) ISSN: 2456-6470 6.1.2Oxygen (O2): Oxygen emission shows irregular variation with load. The emission of O2 for diesel is lower for first 2 loads where as it is higher for the consequent higher loads. From the graph it’s clear that the blend B2.5 shows the highest value for 0kW BP while it is lowest for 2kW BP. Also the value of O2 emission shows lowest value for the minimal and maximum values of BP while they show increasing values for the rest. It is clear that the O2 emission shows irregular variation for different values of BP. O2 VS BP O2 DIESEL O2 B5 O2 B2.5 2 1.5 1 0.5 0 17.5 16 16.5 17 18 18.5 19 BP Fig 6.17 Oxygen vs. brake power 6.1.1Nitrogen oxide (NOx): Exhaust gases of an engine can have up to 2000 ppm of oxides of nitrogen. Most of this exhaust contains nitrogen oxide (NO) with small amount of dioxide. These all come under NOx, x representing some suitable number. NOx is very undesirable as it has many adverse effect on the environment. With increase in load NOx emission increases for diesel where both the blends show slight decrease in emission and gradually increase as diesel. CONCLUSION The current project dealt with the extraction of Pyrolysed oil from HDPE and analysing its performance and emission characteristics once distilled. Diesel was kept as standard and the comparison was made. The raw fuel obtained after pyrolysis was distilled to derive the pure pyrolysis oil. Two blends namely B5 and B2.5 were prepared by blending it with diesel. The flash and fire points of the Pyrolysed oil was tested. The flash and fire points of the oil prepared was less than 37.8ᵒC which makes the fuel under the category of flammable fuels. The next series of tests conducted were the performance analysis. The SFC values of both blends were little less than that of diesel but shown similar variation with respect to BP. The mechanical efficiencies of the 2 blends were lower than that of diesel even though they shown similar variations with BP. The brake thermal efficiencies of both blends were higher than that of diesel and shows similar variations with respect to BP. The indicated thermal efficiencies of both blends were a little higher and shows similar values with respect to diesel. The brake mean effective pressure of both blends were having similar variations with respect to BP value. The indicated mean effective pressure of the prepared blends were higher than that of diesel. The Emission characteristics were checked once the performance characteristics were analysed. The CO emission of both the blends were higher than that of diesel. The CO2 emissions of both the blends were @ IJTSRD | Available Online @ www.ijtsrd.com | Volume – 2 | Issue – 4 | May-Jun 2018 Page: 715
International Journal of Trend in Scientific Research and Development (IJTSRD) ISSN: 2456-6470 REFERENCES 1.Dr. Shinde ‘Conversion of waste plastic into resources’- International Journal on Innovation in Engineering and Technology- Volume 6 issue 3 February 2016 2.Vijaykumar B, Chanashetty and B M Patil, ‘Fuel from Plastic Waste’ International Journal on Emerging Technologies (Special Issue on NCRIET- 2015) 3.Mohamed M Garib Alla, Ahmed I Ahmed , Babiker K Abdalla, ‘Conversion of Plastic waste into liquid fuel’-International Journal of Technical Research and Applications -Volume 2, Issue 3 (May-June 2014). 4.Coulson & Richardson's. ‘Chemical engineering design textbook’- Volume 6. [5]. P Baggio- ‘Experimental & Modeling Analysis of a batch gasification’, ‘Energy conversion & management 2009’. 5.Merve Sogoncioglu –‘Comparative study on Waste Plastic Pyrolysis liquid products quantity &energy recovery potential 2017’. 6.Thallada Bhaskar –‘Pyrolysis of waste plastic using CACO3’, ‘Progress in rubber, plastic & recycling technology Volume- 20, 2004’. 7.P Senthil Kumar –‘Conversion of waste plastic into low emissive hydrocarbon fuels through catalytic deploymerization in a new laboratory scale batch reactor’, International Journal of Energy environment engineering Volume- 8, 2017. higher than that of diesel. The hydrocarbon emission of both blends were lower when compared with that of diesel. The O2 emission of both blends shown irregular variations when compared with that of diesel i.e. from 0 to 0.5kW BP the O2 emissions were higher and for the remaining BP values the O2 emission of blends were lower when compared to diesel. When analysing NOx emission the blends shown lower values compared to diesel. Since the efficiency values are desirable and emission characteristics are fluctuating, for the time being the oil derived could be used to run engines by blending with diesel. From the analysis it was obvious that the blends shown desirable efficiency values but the emission characteristics possessed irregularities. Thus for better emission characteristics, more care should be given while selecting catalysts and providing experimental conditions. This could enhance the emission characteristics of the Pyrolysed oil. Once the emission characteristics are improved this fuel could be used for running diesel engines. @ IJTSRD | Available Online @ www.ijtsrd.com | Volume – 2 | Issue – 4 | May-Jun 2018 Page: 716