Download
1 / 18
190 likes | 199 Vues
This study determined the performance measures of a queue management system in FIRST Bank Nigeria Plc Nnamdi Azikiwe University, Awka. The variables measured include the arrival rate and the service rate from a three server system over a given period of time of the day. Quantitative research method was employed in collecting the data. The observed data was tested using chi square goodness of fit test to determine if the arrival rates are Poisson distributed and the service rates are exponentially distributed. Multiple channel queuing models were used in analyses. The mean arrival and service rates were 10.82 and 9.22 respectively, with a system utilization of 1.2. The probability of having zero customers in the system was used to determine the optimal number of servers needed in the system. It was concluded that Five 5 servers is appropriate instead of three 3 servers currently used by the establishment, using the system utilization of 1.2 to trace the probability of having zero customers in the system which was found to be 0.976 at five servers M=5 . Five 5 server model is recommended for the establishment to reduce the total expected time customers has to wait, and that operation managers should not rely on existing queuing models only, but they should apply their discretion when a queue gets out of hand. Nwosu M. C. | Uhonmhoibhi K. E. | Okorie C. C. | Odii K. C. "Modeling of Queue Management System in Banking Industries" Published in International Journal of Trend in Scientific Research and Development (ijtsrd), ISSN: 2456-6470, Volume-2 | Issue-5 , August 2018, URL: https://www.ijtsrd.com/papers/ijtsrd16973.pdf Paper URL: http://www.ijtsrd.com/engineering/industrial-engineering/16973/modeling-of-queue-management-system-in-banking-industries/nwosu-m-c<br>

E N D
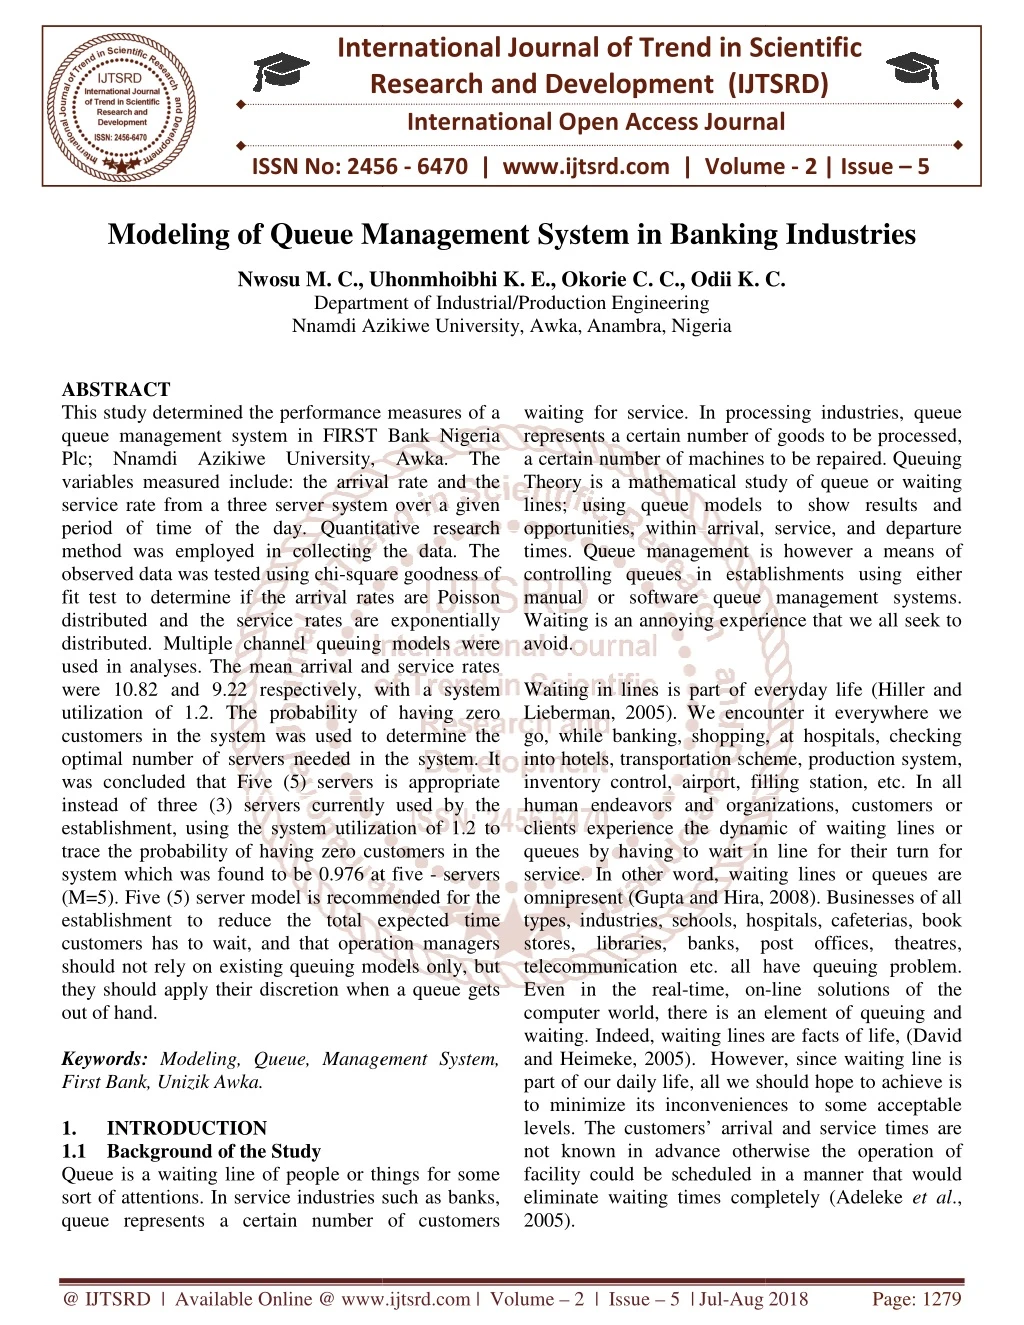
International Research Research and Development (IJTSRD) International Open Access Journal Modeling of Queue Management System in Banking Industries Nwosu M. C., Uhonmhoibhi K. E., Okorie C. C., Odii K. C. Department of Industrial/Production Engineering Nnamdi Azikiwe University, Awka,Anambra, Nigeria International Journal of Trend in Scientific Scientific (IJTSRD) International Open Access Journal ISSN No: 2456 ISSN No: 2456 - 6470 | www.ijtsrd.com | Volume 6470 | www.ijtsrd.com | Volume - 2 | Issue – 5 Modeling of Queue Management System in Banking Industries Modeling of Queue Management System in Banking Industries C. Nwosu M. C., Uh Department of Ind Nnamdi Azikiwe University, ABSTRACT This study determined the performance measures of a queue management system in FIRST Bank Nigeria Plc; Nnamdi Azikiwe University, Awka. variables measured include: the arrival rate and the service rate from a three server system over a given period of time of the day. Quantitati method was employed in collecting the data. The observed data was tested using chi-square goodness of fit test to determine if the arrival rates are Poisson distributed and the service rates are exponentially distributed. Multiple channel queuing models were used in analyses. The mean arrival and service rates were 10.82 and 9.22 respectively, with a system utilization of 1.2. The probability of having zero customers in the system was used to determine the optimal number of servers needed in the was concluded that Five (5) servers is appropriate instead of three (3) servers currently used by the establishment, using the system utilization of 1.2 to trace the probability of having zero customers in the system which was found to be 0.976 at five (M=5). Five (5) server model is recommended for the establishment to reduce the total expected time customers has to wait, and that operation managers should not rely on existing queuing models only, but they should apply their discretion when a queue gets out of hand. Keywords: Modeling, Queue, Management System, First Bank, Unizik Awka. 1. INTRODUCTION 1.1Background of the Study Queue is a waiting line of people or things for some sort of attentions. In service industries such as banks, queue represents a certain number of customers waiting for service. In processing industries, queue represents a certain number of goods to be processed, a certain number of machines to be repaired. Queuing Theory is a mathematical study of queue or wa lines; using queue models to show results and opportunities, within arrival, service, and departure times. Queue management is however a means of controlling queues in establishments using either manual or software queue management systems. Waiting is an annoying experience that we all seek to avoid. Waiting in lines is part of everyday life (Hiller and Lieberman, 2005). We encounter it everywhere we go, while banking, shopping, at hospitals, checking into hotels, transportation scheme, production sy inventory control, airport, filling station, etc. In all human endeavors and organizations, customers or clients experience the dynamic of waiting lines or queues by having to wait in line for their turn for service. In other word, waiting lines or q omnipresent (Gupta and Hira, 2008). Businesses of all types, industries, schools, hospitals, cafeterias, book stores, libraries, banks, post offices, theatres, telecommunication etc. all have queuing problem. Even in the real-time, on computer world, there is an element of queuing and waiting. Indeed, waiting lines are facts of life, (David and Heimeke, 2005). However, since waiting line is part of our daily life, all we should hope to achieve is to minimize its inconvenienc levels. The customers’ arrival and service times are not known in advance otherwise the operation of facility could be scheduled in a manner that would eliminate waiting times completely (Adeleke 2005). erformance measures of a waiting for service. In processing industries, queue represents a certain number of goods to be processed, a certain number of machines to be repaired. Queuing Theory is a mathematical study of queue or waiting lines; using queue models to show results and opportunities, within arrival, service, and departure times. Queue management is however a means of controlling queues in establishments using either manual or software queue management systems. s an annoying experience that we all seek to queue management system in FIRST Bank Nigeria Plc; Nnamdi Azikiwe University, Awka. The variables measured include: the arrival rate and the service rate from a three server system over a given period of time of the day. Quantitative research method was employed in collecting the data. The square goodness of fit test to determine if the arrival rates are Poisson distributed and the service rates are exponentially ng models were used in analyses. The mean arrival and service rates were 10.82 and 9.22 respectively, with a system utilization of 1.2. The probability of having zero customers in the system was used to determine the optimal number of servers needed in the system. It was concluded that Five (5) servers is appropriate instead of three (3) servers currently used by the establishment, using the system utilization of 1.2 to trace the probability of having zero customers in the Waiting in lines is part of everyday life (Hiller and Lieberman, 2005). We encounter it everywhere we go, while banking, shopping, at hospitals, checking into hotels, transportation scheme, production system, inventory control, airport, filling station, etc. In all human endeavors and organizations, customers or clients experience the dynamic of waiting lines or queues by having to wait in line for their turn for service. In other word, waiting lines or queues are omnipresent (Gupta and Hira, 2008). Businesses of all types, industries, schools, hospitals, cafeterias, book stores, libraries, banks, post offices, theatres, telecommunication etc. all have queuing problem. at five - servers (M=5). Five (5) server model is recommended for the establishment to reduce the total expected time customers has to wait, and that operation managers should not rely on existing queuing models only, but n when a queue gets -line solutions of the computer world, there is an element of queuing and waiting. Indeed, waiting lines are facts of life, (David and Heimeke, 2005). However, since waiting line is part of our daily life, all we should hope to achieve is to minimize its inconveniences to some acceptable levels. The customers’ arrival and service times are not known in advance otherwise the operation of facility could be scheduled in a manner that would eliminate waiting times completely (Adeleke et al., Modeling, Queue, Management System, Queue is a waiting line of people or things for some sort of attentions. In service industries such as banks, queue represents a certain number of customers @ IJTSRD | Available Online @ www.ijtsrd.com @ IJTSRD | Available Online @ www.ijtsrd.com | Volume – 2 | Issue – 5 | Jul-Aug 2018 Aug 2018 Page: 1279
International Journal of Trend in Scientific Research and Development (IJTSRD) ISSN: 2456-6470 II.Queue: The number of customers waiting to be served. The queue does not include the number of customers being served. III.Service Channels: The process or facility which is performing the services that the customers demand. This may be multiple or single channel, and may have different phases. Stability of Queuing System A.Stable Condition ?A queue is stable, when it does not grow to become infinite over time. ?The single-server queue is stable if on the average, the service time is less than the inter-arrival time, i.e. mean service time < mean inter-arrival time. Behavior of a Stable Queue Mean service time < mean inter-arrival time Operations managers recognize the trade-off that must take place between the cost of providing good services to customers and the cost of customers’ waiting time. However, managers are willing to allow some waiting if a significant saving in service balances the waiting costs (Adedayo et al., 2006). Service costs seem to increase as a firm attempts to raise its quality level of service. To accomplish this, managers need to determine optimum servers, good waiting time and other queuing parameters, and a conduct and coordination of activities within a complex system such as hospitals, banks, filling station, etc. using tools like mathematical modeling, linear programming, queuing model, and simulation. These instruments can be used to study the consequences of alternative courses of action and to optimize performance of the system. Queuing System of a Typical Establishment: The queue system operates by the establishment (First bank of Nigeria, Nnamdi Azikiwe University, branch) is multiple queue, multiple servers or channels. In this type of queuing system, customers arrive at a service center having several waiting lines, each line with one server. The customers choose a server according to some mechanism (e.g. shortest queue or shortest work load). That is, customers have the right to select and join any of the queues they feel is faster and can exhibit such behaviour such as jockeying, reneging and balking. Servers and channels are used interchangeably; it could be a person, machine, computer, or both. Figure 2: Behavior of a Stable Queue When the queue is stable, we will observe busy and idle periods continuously alternating. B. Unstable Condition In this condition, the queue continuously increases. This is the case when a car accident occurs on the highway. Here, the mean service time > mean inter- arrival time. Behaviour of Unstable Queue Figure 1: Multiple Queues,Multiple Servers System Components of a Queuing System Queue system comprises of customers, queue, servers or channels. I.Customers: The arriving unit that requires some service to be performed. The customer may be persons, machines, vehicles, parts, goods, etc. Figure 3: Behavior of Unstable Queue @ IJTSRD | Available Online @ www.ijtsrd.com | Volume – 2 | Issue – 5 | Jul-Aug 2018 Page: 1280
International Journal of Trend in Scientific Research and Development (IJTSRD) ISSN: 2456-6470 1.2 Statement of the Problem In this work, it has been noted that some establishments or organizations could not predict the optimal number of servers the establishment will need to solve the problem of customer’s arrival rate to avoid queuing or waiting before customers are been served. And to correlate the cost implication of having more or less optimal number of servers in their establishment and customers getting satisfied or dissatisfied with their service, as there will always be a trade-off of one item to another. 1.3Aim and Objectives of the Study The aim of this research work is to minimize optimally, the customers’ waiting time, or to avoid waiting for a long time before a customer is being served. Other objectivesare: I.To achieve a better quality of service to customers that will maximize the profit of the organization. II.Data will be collected from the chosen establishment and analyzed to understand the current queuing characteristics and behavior of the system. III.Models will be generated that will help in managing the queuing establishment investigated. 1.4 Hypothesis Hypothesis 1: With the same total number of people waiting, the expected waiting period will be shortest with a Multiple Queue structure follow by single queue structure and longest in a Numbered Queue structure. Hypothesis 2: Increase in servers will not increase the service delivery and decrease customer waiting time. Hypothesis 3: If the probability of customers waiting to be served is high, the service channels must be increased. 1.5 Significance of the Study The importance of this research work is that it will guide the management of the establishment for a better control of their queuing problems. Also, it helps to determine if the queue management system adopted by the organization is economically viable. It will enable the management of the establishment to be more accurate during planning. 1.6 Methodology There are lots of methods that any researcher can use to achieve his goal in queue management problems. But the reliability of the method depends on what the researcher stands to achieve. In this research, crucially, quantitative research approach will be adopted for use over other research methodology. Though qualitative research will still be used to get some necessary information that may not go into the model for analysis The two main approaches or types of research method that will be used by the researchers in collecting the data for the analysis of the problem of queue management in this thesis include the following; I.Quantitative research method II.Qualitative research method 2. Literature Review 2.1 Brief History of Queuing Theory Agner Krarup Erlang, a Danish engineer who worked for the Copenhagen Telephone Exchange, published the first paper on queuing theory in 1909. He modeled the number of telephone calls arriving at an exchange by a Poisson process and solved the M/D/1 queue in 1917 and M/D/k queuing model in 1920. Felix Pollaczek solved the M/G/1 queue in 1930, a solution later recast in probabilistic terms by Aleksandr Khinchin. After World War II queuing theory became an area of research interest to mathematicians. David G. Kendall introduced an A/B/C queuing notation in 1953. Work on queuing theory used in modern packet switching networks was performed in the early 1960s by Leonard Kleinrock. 2.2 Theoretical Framework The French mathematician S.D. Poisson (1781-1840) was credited with the pioneering work on queuing theory. He created a distribution function to describe the probability of a prescribed outcome after repeated iterations of independent trials. Nevertheless, it was first applied in industrial setting by A. K. Erlang in 1909 in the context of telephone facilities. Thereafter, it has been extensively practiced or utilized in industrial setting or retail sector – operations management, and falls under the purview of decision sciences (Singh, 2007). problems of the @ IJTSRD | Available Online @ www.ijtsrd.com | Volume – 2 | Issue – 5 | Jul-Aug 2018 Page: 1281
International Journal of Trend in Scientific Research and Development (IJTSRD) ISSN: 2456-6470 Kendall (1951, 1953) was the pioneer who viewed and developed queuing theory from the perspective of stochastic processes. The literature on queuing theory and the diverse areas of its applications has grown tremendously (Medhi, (2003); Prabhu (1987); Takagi (1991); Dshalalow (1995, 1997)). In fact, Takagi and Boguslavsky (1990) put forth a bibliography of books and survey papers on application of queuing in industrial settings. Queuing theory analysis involves the study of system behavior over time (Prem Kumar Gupta). Queuing formulas are usually applied to a limited number of pre-determined, simplified models of real processes for which analytical formulas can be developed (Kolker, 2009). Queue occurs any time there is more customer demand for service than can be provided. 2.3 Basics of Queuing Theory Basic structure of queuing model can be separated into input and output queuing system, which include queue that must obey a queuing rule and service mechanics (Hillier and Lieberman, 2005). The simplest queuing model is called single–server single queue model as illustrated in figure 4. Single–server model has a single server and a single line of customers (Krasewski and Ritzman, 1998). It is a situation in which customers from a single line are to be served by a single service facility or server, one after the other. For application of queuing model to any situation we should first describe the input process and the output process (Singh 2007). In Nigeria, a study conducted by Oladapo (1988) revealed a positive correlation between arrival rates of customers and bank’s service rates. He concluded that the potential utilization of the banks service facility was 3.18% efficient and idle 68.2% of the time. However, Ashley (2000) asserted that even if service system can provide service at a faster rate than customers arrival rate, waiting lines can still form if the arrival and service processes are random. One week survey conducted by Elegalam (1978) revealed that 59.2% of the 390 persons making withdrawals from their accounts spent between 30 to 60 minutes while 7% spent between 90 and 120 minutes. Baale (1996) while paraphrasing Alamatu and Ariyo (1983) observed that the mean time spent was 53 minutes but customers prefer to spend a maximum of 20 minutes. Their study revealed worse service delays in urban centres (average of 64.32 minutes) compared to (average of 22.2 minutes) in rural areas. To buttress these observations, Juwah (1986) found out that customers spend between 55.27 to 64.56 minutes making withdrawal from their accounts. Efforts in this study are directed towards application of queuing models in capacity planning to reduce customer waiting time and total operating costs. Source: Design by Krasewski and Ritzman, 1998). Figure 4: A High-Level View of a Basic Queuing Process 2.4 Input and Output Process Input process is known as the arrival process. Customers are known as arrivals which are generated one time by an input source randomly from finite or infinite population. These customers enter the queuing system and join a queue to be served. In the hospital or banking setting, the group of individuals from which arrivals come is referred to as the call-in population. Variations occur in this population’s size. Total customers demand requiring services from time to time constitute the size of arrival (Tutunci, 2009). @ IJTSRD | Available Online @ www.ijtsrd.com | Volume – 2 | Issue – 5 | Jul-Aug 2018 Page: 1282
International Journal of Trend in Scientific Research and Development (IJTSRD) ISSN: 2456-6470 At all times, a member of the customers on the queue is selected for service by some rules known as the queue discipline. The required service is then performed for the customer by the service mechanism, after which the customer leaves the queuing system (Hillier and Lieberman, 2005). The provision of services using certain rule and discharge of customers is referred to as output process An important point to be noted before proceeding with further discussion is that the most sort of bank/health services have the capacity to serve more customers/patients (on the average) than they are called to over the long term, so that customer waiting lines is a short term phenomenon and the employees (servers) who serve customers may be frequently inactive while they wait for the customer to arrive (Ozcan, 2006). Another fact worth mentioning here is that the key word in queuing models is “average”. It takes the average of the random numbers of patients arriving, the service time arrival intervals, et cetera. (Singh, 2007). 2.5 Assumptions and limitations of Queuing Theory 2.5.1 Assumptions The basic assumptions in queuing theory entails that the service discipline is first come, first served. The customer behaviour is normal, that is, customers desiring service join the queue, wait for their turn and leave only after getting serviced. The do not resort to balking, reneging or jockeying. The service facility behaviour is normal, that is, it serves the customers continuously without break, and as long as there is queue (also it serves only one customer at a time). (Prem Kumar Gupta and D. S Hira, 2008). The assumptions of classical queuing theory may be too restrictive to be able to model real-world situations exactly. The complexity of production lines with product-specific characteristics cannot be handled with those models. Therefore specialized tools have been developed to simulate, analyze, visualize and optimize time dynamic queuing line behaviour. For example; the mathematical models often assume infinite numbers of customers, infinite queue capacity, or no bounds on inter-arrival or service times, when it is quite apparent that these bounds must exist in reality. Often, although the bounds do exist, they can be safely ignored because the differences between the real-world and theory is not statistically significant, as the probability that such boundary situations might occur is remote compared to the expected normal situation. Furthermore, several studies show the robustness of queuing assumptions. In other cases the theoretical solution may either prove intractable or insufficiently informative to be useful. 2.5.2 Limitations Moreover, the waiting space for the customers is usually limited; the arrival rate may be state dependent, that is, an arriving customer on seeing a long queue, may not join it and go away without getting service. The arrival process may not be stationary, there be peak period and slack period during which the arrival may be more or less than the average arrival rate. Services may not be rendered continuously. The service facility may break down; also the service may be provided in batches rather than individually (Prem Kumar Gupta and D.S Hira, 2008). Alternative means of analysis have thus been devised in order to provide some insight into problems that do not fall under the scope of queuing theory, although they are often scenario-specific because they generally consist of computer simulations or analysis of experimental data. See network traffic simulation. 2.6Queuing System Characteristics According to Adedayo et al (2006) and Medhi (2003), queuing phenomenon comprises of the following basic characteristics: I. Arrival characteristics II. The queue or the physical line itself III. The number of servers or service channels IV. Queue discipline V. Service mechanism VI. The capacity of the system VII. Departure. 2.7Arrival Characteristics Arrival pattern describes the behaviour of customers’ arrival. It is specified by the inter-arrival time between any two consecutive arrivals (Medhi, 2003). The inter-arrival time may be deterministic or stochastic in nature. Arrival can occur from unlimited population (infinite) or limited (finite or restricted population) (Adedayo et al, 2006). There are four main descriptors of arrivals as put forth by Davis et al, (2003) as shown in figure 5. models outside their @ IJTSRD | Available Online @ www.ijtsrd.com | Volume – 2 | Issue – 5 | Jul-Aug 2018 Page: 1283
International Journal of Trend in Scientific Research and Development (IJTSRD) ISSN: 2456-6470 I. The pattern of arrivals (whether arrivals are controllable or uncontrollable) The size of arrival units (whether the arrival occurs one at a time or in batches/bulk) The distribution pattern (whether the time between arrivals is constant or follow statistical distribution exponential, etc.) The degree of patience (whether the arrival stays in line or leave). in order of arrival. In this study the case hospitals use FCFS queuing discipline. Although, sometimes there are other service disciplines: last come, first served (which happens sometime in case of emergencies),or service-in-random order and priority rule. Davis et al, (2003) assert that reservations first, emergencies first, highest profit customer first, largest orders first, best customers first, longest waiting time in line, and soonest promised date are other examples of queue discipline. Unless otherwise stated, the queuing model adopted in this study assumes arrival from infinite source with infinite queue and with first in first served (FCFS) queue discipline. 2.10 Service Mechanism According to Mosek and Wilson (2001), service mechanism describes how the customer is served. In a single server system each customer is served by exactly one server, even though there may be multiple servers. In most cases, service times are random and they may vary greatly. Sometimes the service time may be similar for each job or constant. The service mechanism also describes the number of servers. A queuing system may operate with a single server or a number of parallel servers. An arrival who finds more than one free server may choose at random any one of them for receiving service. If he finds all the servers busy, he joins a queue common to all servers. The first customer from the common queue goes to the server who becomes free first (Medhi, 2003). 2.11 Capacity of the Queuing System A system may have an infinite capacity-that is, the queue in front of the server(s) may grow to any length. Furthermore, there may be limitation of space and so when the space is filled to capacity, an arrival will not be able to join the system and will be lost to the system. The system is called a delay system or a loss system, according to whether the capacity is infinite or finite respectively (Medhi, 2003). 2.12 Rate of Departure Once customers are served, they depart and may not likely re-enter the system to queue again. It is usually assumed that departing customers do not return into the system immediately (Adedayo, et al., 2006). Chase et al., (2004) is of the opinion that once a customer is served, two exit fates are possible as shown in figure 6. I. The customer may return to the source population and immediately become a competing candidate for service again. II. III. such a poisson, IV. Figure 5: Arrival Characteristics in Queue (Source: Davis et al., (2003)). 2.8 Waiting Line or Queue A waiting line or queue occurs when customers wait before being served because the service facility is temporarily engaged. A queue is characterized by the maximum permissible number of customers that it can contain. Queues are called infinite or finite, according to whether this number is infinite or finite (Hillier and Lieberman 2001). An infinite queue is one in which for all practical purposes, an unlimited number of customers can be held there. When the capacity is small enough that it needs to be taken into account, then the queue is called a finite queue (Hillier and Hillier, 2003). Unless specified otherwise, the adopted queuing network model in this study assumes that the queue is an infinite queue. 2.9 Queue Discipline The queue discipline refers to the order in which members of the queue are selected for service (Hillier and Lieberman, 2001). Winston and Albright (1997) posit that the usual queue discipline is first come, first served (FCFS or FIFO), where customers are served @ IJTSRD | Available Online @ www.ijtsrd.com | Volume – 2 | Issue – 5 | Jul-Aug 2018 Page: 1284
International Journal of Trend in Scientific Research and Development (IJTSRD) ISSN: 2456-6470 II. ii. There may be a low probability of re- service. In hospitals, departure means home discharge, admission or death (Smith and Mayhew, 2008). Figure 6: Departure (Source: Davis et al., (2005)) Figure 8: Single Queue, Multiple Server System 0 = Customers and S = available servers 2.13 Types of Queuing System There are four major types of queuing system and different combinations of the same can be adopted for complex networks. Lapin (1981) broadly categorized queuing system structures into the following. I.Single Queue, Single Server System: This is a situation in which single queue of customers are to be served by a single service facility (server) one after the other. An example is flu vaccination camp where a nurse practitioner is the server who does all the work (i.e. .paper work and vaccination (Singh, 2007). Diagrammatically, it is depicted in figure 7. III. Multiple Queues,Multiple Servers System: According to Singh (2007), this type of system has numerous queues and a complex network of multiple phases of services involved as can be seen in figure 9. This is the type of queuing system adopted in this study. This type of service is typically seen in a hospital setting, multi-specialty outpatient clinics, patient first form the queue for registration, and then he/she is triage for assessment, then for diagnostics, review, treatment, intervention or prescription and finally exits from the system or triage to different provider. Figure 9: Multiple Queues, Multiple Servers System 2.14 Queuing System Terminologies and Notations Queuing theory is a mathematical theory with its own standard terminologies and notations. Few of the basic terminology and notations used in queuing model that are relevant in this study are enumerated below; ?=Average (mean) arrival rate i.e. the rate of arrivals of customers at a system ?=Average (mean) service rate i.e. the rate at which customers could ? ?=Expected inter arrival time. Figure 7: Single Queue, Single Server System. 0 = Customers and S = available servers II.Single Queue, Multiple-Servers System: This is a queuing system characterized by a situation whereby there is a more than one service facility (servers) providing identical service but drawn on a single waiting line (Obamiro, 2005). An example is patient waiting to see consultants (physicians) at general outpatient department of teaching hospitals as illustrated by figure 8. be served @ IJTSRD | Available Online @ www.ijtsrd.com | Volume – 2 | Issue – 5 | Jul-Aug 2018 Page: 1285
International Journal of Trend in Scientific Research and Development (IJTSRD) ISSN: 2456-6470 ? ? = Expected service time. ? ?? = system utilization factor, where s is the number of servers. The formula is usually denoted by e or rho. e or rho represents the fraction of the system’s service capacity (s?) that is being utilized in the average by arriving customers (?) (Hiller and Lieberman, 2001). Lq = Average number of customers waiting for λ? µ(µ?λ) = Wq = Average number of customers in the system (those waiting and receiving service). = Lq=Average time customers spent in the queue = λ µ-λ Ws = Average time customers spent in the system = ? ??λ or Po = probability of zero customers in the system Po = 1 − Pn = probability of exactly n units or customers in the system. P(x=n) = 1−λ Probability of more than n units in the system = pn 2.15 Summary of Queuing Model Assumptions Hiller and Hiller (2003) summarized the assumption generally made by queuing models of a basic queuing system. Each of these assumptions should not be taken for granted unless a model explicitly states otherwise. I.Inter-arrival times identically distributed according to a specified probability distribution. II.All arriving customers enter the queuing system and remain there until service has been completed. III.The queuing system has a single infinite queue, so that the queue will hold an unlimited number of customers. IV.The queue discipline is first- come, first-served. V.The queuing system has a specified number of servers VI.Each customer is served individually by any one of the servers. VII.Services times are independent and identically distributed according to a specified probability. 2.16 Types of Queuing Models There are at least forty (40) queuing models based on different queue management goals and service conditions. It is easy to apply the wrong model, ostensibly, for lack of appropriate theoretical background (Weber, 2006). Kolker (2009) asserts that development of tractable analytic formulas is possible only if a flow of event in the system is a steady-state Poisson process where the average inter-arrival time assumes a Poisson distribution and service time is assumed to follow an exponential distribution. The various types of queuing models can be classified (according to Prem Kumar Gupta) as follows; 2.16.1 Probabilistic Queuing Models Model I (Erlang model): This model is symbolically represented by (M/M/1): (FCFS/∞/∞). This represent Poisson arrival (exponential inter arrival), Poisson departure (exponential service time), single server, first come, first served service discipline, infinite population. Since the Poisson and exponential distributions are related to each other, both of them are denoted by the symbol ‘M’ due to Markovian property of exponential distribution. Model II (General Erlang Model): It is a general queuing model in which the arrival and service rates depend upon the length of the queue. Some persons desiring service may not join the queue since it is too long, thus affecting arrival rate. Similarly service rate is also affected by the length of the queue. Model III: This model is represented by (M/M/1): (SIRO/∞/∞). It is essentially the same as model 1 except that the service discipline is service in random order (SIRO) instead of first come, first served (FCFS). Model IV: This model is represented by (M/M/1): (FCFS/N/∞). In this model, the capacity of the system is limited or finite, say N. so the number of arrivals cannot exceed N. ?? service = ???? ? λ ??λ or ??? ? λ(???) λ ? or 1−? ?(λ ?)2 = (1−?)?n are independent and @ IJTSRD | Available Online @ www.ijtsrd.com | Volume – 2 | Issue – 5 | Jul-Aug 2018 Page: 1286
International Journal of Trend in Scientific Research and Development (IJTSRD) ISSN: 2456-6470 IV. System Utilization: System Utilization is the ratio of system capacity used to available capacity. It measures the average time the system is busy. V. Mean Number in the system (Ls or N(t)): Mean number in the system is the average number of system users (entities) in the system; it includes those in the queue and those being served by the server(s). VI. Mean Number in Queue (Lq): Mean number in the queue is the average or expected number of system users (patients) in the queue (waiting line), waiting for their turn to be served. VII. Mean Time in System (Ws): Mean time in the system is the expected value or average waiting time an entity (patients) will spend in the queuing system. It includes the average time waiting for service to begin and the average service time. VIII. Mean Time in Queue (Wq): Mean time in the queue is the expected value or average time an entity will spend in the queue, waiting for service to begin. IX. Probability of n in the system (Pn): This is the probability that there are exactly n entities in the system (queue and serving mechanism together) at a point in time. X. Probability of waiting (pw): This is the probability that an arrival will have to wait for its service to begin. From the above complete description of queuing performance parameters, the problems studied in queuing theory may be grouped as (Medhi, 2003): ? Stochastic behaviour of various random variables, or stochastic processes that arise, and evaluation of the related performance measures; ? Method of solution: exact, transform, algorithmic, asymptotic, numerical, approximations, etc. ?Nature of solution: time dependent, limiting form, etc. ?Control and design of queues: comparison of behaviour and performance situations, as well as queue disciplines, service rules, strategies, etc., and ?Optimization of specific objective functions involving performance measures, associated cost functions, etc. 2.18 Applications of Queuing System Applications are frequently encountered in customer service situations as well as transport and Model V: This model is represented by (M/M/1): (FCFS/n/M). It is finite-population or limited source model. In this model, the probability of an arrival depends on the number of customer available to enter the system. Model VI: This model is represented by (M/M/c): FCFS/∞/∞). This is the same as model I except that there are c service channels working in parallel. Model VII: This model is represented by (M/Ek/1): (FCFS/∞/∞). In this model, instead of exponential service time, there is Erlang service time with k phases. Model VIII: This model is represented by (M/M/1): (GD/m/n), where m≤n. it represents machine repair problem with a simple repairman. n is the total number of machine out of which m are broken down and forming a queue. GD represents a general service discipline. Model IX: This model is represented by (M/M/c): (GD/m/n), m≤n. It is same as model VIII except that there are c repairmen, c<n. Model X: This is called power supply model. 2.16.2.Deterministic Model Model XI: This model is represented by (D/D/1): (FCFS/∞/∞). In this model, inter arrival time as well as service time are fixed and known with certainty. The model is therefore called deterministic model. 2.16.3 Mixed Queuing Model Model XII: This model is represented by (M/D/1): (FCFS/∞/∞). Here, arrival rate is Poisson distributed while the service rate is deterministic constant. 2.17 Performance Measures (parameters) of a Queuing System Stafford (2004), Hillier and Lieberman (2005), Carter and Price (2001), etc., put forth the following performance parameters in a queuing system: I.λ n = mean arrival rate ( expected number of arrivals per unit time) of new customer when n customers are in the system II.µn = mean service rate for overall system (expected number of customers completing service per unit time) when n customers are in system. III. s = represents number of servers under various @ IJTSRD | Available Online @ www.ijtsrd.com | Volume – 2 | Issue – 5 | Jul-Aug 2018 Page: 1287
International Journal of Trend in Scientific Research and Development (IJTSRD) ISSN: 2456 International Journal of Trend in Scientific Research and Development (IJTSRD) ISSN: 2456 International Journal of Trend in Scientific Research and Development (IJTSRD) ISSN: 2456-6470 telecommunication. Queuing theory is directly applicable to intelligent transportation systems centers, PABXs, networks, telecommunications server queuing, mainframe telecommunications telecommunications systems, and traffic flow The public switched telephone network designed to accommodate the offered traffic intensity with only a small loss. The performance systems is quantified by their grade of service by the assumption that if sufficient capacity is not available, the call is refused and lost. Alternatively, overflow systems make use of alternative routes divert calls via different paths — even these systems have a finite traffic carrying capacity. However, the use of queuing in PSTNs allows the systems to queue their customers' requests until free resources become available. This means that if traffic intensity levels exceed available capacity, customer's calls are not lost; customers instead wait until they can be served. This method is used in queuing customers for the next available operator. A queuing discipline determines the manner in which the exchange handles calls from customers. the way they will be served, the order in which they are served, and the way in which resources are divided among the customers. Here are details of four queuing disciplines: First in First Out This principle states that customers are served one at a time and that the customer that has been w longest is served first. Last in First Out This principle also serves customers one at a time; however the customer with the shortest waiting time will be served first, also known as a stack Processor Sharing Customers are served equally. Network capacity is shared between customers and they all effectively experience the same delay. Priority: Customers with high priority are served first. Queuing is handled by control processes within exchanges, which can be modeled using state exchanges, which can be modeled using state ng theory is directly equations. Queuing systems use a particular form of equations. Queuing systems use a particular form of state equations known as a Markov chain the system in each state. Incoming traffic to these systems is modeled via a Poisson distribution subject to Erlang’s queuing theory assumptions viz. I. Pure-chance traffic departures are random and II. Statistical equilibrium the system do not change. III. Full availability – All incoming traffic can be routed to any other customer network. IV. Congestion is cleared as soon as servers are free. Classic queuing theory involves complex calculations to determine waiting time, service time, server utilization and other metrics that are used to measure queuing performance. 2.19 Queuing Networks Networks of queues are systems which contain an arbitrary, but finite, number m sometimes of different classes, travel through the network and are served at the nodes. The state of a network can be described by a vector where ki is the number of customers at queue open networks, customers can join and l system, whereas in closed networks the total number of customers within the system remains fixed. The first significant results in this area were networks, for which an efficient equilibrium distribution exists and the analysis which allows average metrics such as throughput and sojourn times to be computed. 2.20 Utilization Utilization is the proportion of the system's resources which is used by the traffic which arrives at it. It should be strictly less than function well. It is usually represented by the symbol . If then the queue will continue to grow as time goes on. In the simplest case of an (Poisson arrivals and a single Poisson server) then it is given by the mean arrival rate over the mean service rate, that is, intelligent transportation systems, call telecommunications, Markov chain that models the system in each state. Incoming traffic to these Poisson distribution and is subject to Erlang’s queuing theory assumptions viz. computer computer of telecommunications terminals, terminals, advanced advanced traffic flow. – Call arrivals and departures are random and independent events. Statistical equilibrium – Probabilities within the system do not change. All incoming traffic can be routed to any other customer within the public switched telephone network (PSTN) is designed to accommodate the offered traffic intensity performance of loss grade of service, driven by the assumption that if sufficient capacity is not available, the call is refused and lost. Alternatively, Congestion is cleared as soon as servers are alternative routes to even these systems involves complex calculations to determine waiting time, service time, server utilization and other metrics that are used to measure However, the use of queuing in PSTNs allows the systems to queue their customers' requests until free resources become available. This means that if traffic ntensity levels exceed available capacity, customer's calls are not lost; customers instead wait until they can be served. This method is used in queuing customers for the next available operator. Networks of queues are systems which contain an m of queues. Customers, sometimes of different classes, travel through the network and are served at the nodes. The state of a network can be described by a vector is the number of customers at queue i. In open networks, customers can join and leave the system, whereas in closed networks the total number of customers within the system remains fixed. A queuing discipline determines the manner in which change handles calls from customers. It defines the way they will be served, the order in which they are served, and the way in which resources are , rs. Here are details of four The first significant results in this area were Jackson r which an efficient product form exists and the mean value which allows average metrics such as throughput and sojourn times to be computed. This principle states that customers are served one at a time and that the customer that has been waiting the This principle also serves customers one at a time; however the customer with the shortest waiting time Utilization is the proportion of the system's resources which is used by the traffic which arrives at it. It stack. one for the system to function well. It is usually represented by the symbol then the queue will continue to grow as time goes on. In the simplest case of an M/M/1 queue arrivals and a single Poisson server) then it is given by the mean arrival rate over the mean service Customers are served equally. Network capacity is shared between customers and they all effectively Customers with high priority are served Where, is the mean arrival rate and service rate. is the mean arrival rate and is the mean Queuing is handled by control processes within @ IJTSRD | Available Online @ www.ijtsrd.com @ IJTSRD | Available Online @ www.ijtsrd.com | Volume – 2 | Issue – 5 | Jul-Aug 2018 Aug 2018 Page: 1288
International Journal of Trend in Scientific Research and Development (IJTSRD) ISSN: 2456 International Journal of Trend in Scientific Research and Development (IJTSRD) ISSN: 2456 International Journal of Trend in Scientific Research and Development (IJTSRD) ISSN: 2456-6470 3. 3.1Research Methods The two main approaches or types of research method used by the researchers in analyzing the problem of queue management include the following; I.Qualitative research method II.Quantitative research method 3.1.1 Quantitative Research Method This method involves collectin into numerical form so that statistical calculations can be made and conclusions drawn. The research method used in this work is a quantitative research approach. The data gathered were the daily record of queuing system over a wee The variables measured include arrival rate ( service rate (µ). They are analyzed for simultaneous efficiency in customer minimization through the use of multi queuing models, which are compared for a number of queue performances such as; the average time each customer spends in the queue and in the system, average number of customers in the queue and in the system and the probability of the system being idle. 3.2 Field Data Collection Essentially, the primary source direct observations and recording of the service performance of the establishment while the researcher was involved in daily timing of the arrival rate for a period of one week. The following tables in Appendix – A showed the data collected. 3.3 Models and Tools Used By the Researcher to Compute for Measurements The following formulas will be used by the researchers to calculate the parameters that will be used to find the results of the problems identified and the hypothetical statements (see chapter four). The average number of customers being served(R) ? = The average number of customers being served in server 1(R1) ??= The average number of customers being server 1(R2) ??= Materials and Methods Materials and Methods More generally, Where service rate, and M is the number of servers. general, a lower utilization corresponds to less queuing for customers but means that the system is more idle, which may be considered inefficient. 2.21 Role of Poisson Distributions A useful queuing model represents a real with sufficient accuracy and is analytically tractable. A queuing model based on the Poisson process companion exponential probability distribution often meets these two requirements. A Poisson process models random events (such as a customer arrival, a request for action from a web server, or the completion of the actions requested of a web server) as emanating from a memory less process, that is, the length of the time interval from the current time to the occurrence of the next event does not depend upon the time of occurrence of the last event. In the probability distribution, the observer records the number of events that occur in a time interval of fixed length. In the (negative) exponentia distribution, the observer records the length of the time interval between consecutive events. In both, the underlying physical process is memory less. Models based on the Poisson process often respond to inputs from the environment in a manner that mimics the response of the system being modeled to those same inputs. The analytically tractable models result to both information about the system being modeled and the form of their solution. Even a queuing model based on the Poisson process that does a relatively poor job of mimicking detailed system performance can be useful. The fact that such models often give "worst-case" scenario evaluations appeals to system designers who prefer to include a safety factor in their designs. Also, the form of the solution of models based on the Poisson process often provides insight into the form of the solution to a queuing problem whose detailed behavior is poorly mimicked. As a result, queuing models are frequently modeled as Poisson processes through the use of the distribution. types of research method used by the researchers in analyzing the problem of queue management include the following; Qualitative research method Quantitative research method is the mean arrival rate, service rate, and M is the number of servers. In general, a lower utilization corresponds to less queuing for customers but means that the system is considered inefficient. is the mean Quantitative Research Method This method involves collecting and converting data into numerical form so that statistical calculations can be made and conclusions drawn. Role of Poisson Process, Process, Exponential Exponential A useful queuing model represents a real-life system with sufficient accuracy and is analytically tractable. The research method used in this work is a quantitative research approach. The data gathered were the daily record of queuing system over a week. The variables measured include arrival rate (λ) and They are analyzed for simultaneous efficiency in customer minimization through the use of multi-channel queuing models, which are compared for a number of performances such as; the average time each customer spends in the queue and in the system, average number of customers in the queue and in the system and the probability of the system being idle. Poisson process and its companion exponential probability distribution often Poisson process andom events (such as a customer arrival, a request for action from a web server, or the completion of the actions requested of a web server) satisfaction satisfaction and and cost cost ess, that is, the length of the time interval from the current time to the occurrence of the next event does not depend upon the time of occurrence of the last event. In the Poisson , the observer records the number of events that occur in a time interval of fixed exponential probability , the observer records the length of the time interval between consecutive events. In both, the underlying physical process is memory less. Essentially, the primary source of data was from direct observations and recording of the service performance of the establishment while the researcher was involved in daily timing of the arrival rate for a period of one week. The following tables in Appendix often respond to inputs from the environment in a manner that mimics the response of the system being modeled to those same inputs. The analytically tractable models result to both information about the system being modeled the form of their solution. Even a queuing model ed. Models and Tools Used By the Researcher to Compute for System System Parameter Parameter that does a relatively The following formulas will be used by the researchers to calculate the parameters that will be used to find the results of the problems identified and thetical statements (see chapter four). poor job of mimicking detailed system performance hat such models often give case" scenario evaluations appeals to system designers who prefer to include a safety factor in their designs. Also, the form of the solution of models based on the Poisson process often provides insight he solution to a queuing problem whose detailed behavior is poorly mimicked. As a are frequently modeled as through the use of the exponential The average number of customers being served(R) ? ? (3.1) The average number of customers being served in ?? ?? (3.2) The average number of customers being served in ?? ?? (3.3) @ IJTSRD | Available Online @ www.ijtsrd.com @ IJTSRD | Available Online @ www.ijtsrd.com | Volume – 2 | Issue – 5 | Jul-Aug 2018 Aug 2018 Page: 1289
International Journal of Trend in Scientific Research and Development (IJTSRD) ISSN: 2456-6470 I. Average number of Customers in Line ???? ?? (???)!(????)? ?? (P. K. Gupta and Hira, 2008) The average number of customers being served in server 3(R3) ??= Where; ?=Average (mean) arrival rate i.e. the rate of arrivals of customers at a system ?=Average (mean) service rate i.e. the rate at which customers could be served 3.3.1 System Utilization System Utilization for each Channel can be expressed as ? = ??= ??= ??= Where ? is system utilization, M is the number of servers Expected inter arrival time per half hour = ? Expected Service Time per half hour = ? The probability of zero units in the system Ρ?= 1 − The probability of three units in the system Ρ?= Ρ??? 3.3.2 Models for Multiple Channel System, M/M/m Queue Models Use of the model involves the following assumptions: I.A Poisson arrival rate and exponential service time II.Servers all work at the same average time III.First-come, First-served service discipline IV.Customers arrive from infinite population source These models include; ? ?? ?? Lq= (3.4) (3.14) II. Probability of Zero Customers in the System(??) ?? ?? ?! ?!??? and Hira, 2008) ?? ? ? ?? ?? ??? ??? (??) = ?∑ + ???? (P.K. Gupta ? (3.15) III. Average Waiting Time for an Arrival not Immediately Served (??) (??) = IV. Probability that an Arrival will have to Wait for Service (??) (??) = Where ?? is the average time customers wait in line (??) ? ??? ? (3.16) ? ?(?) (3.6) ?? ??(??) (3.7) ?? ?? (3.17) ?? ??(??) (3.8) ?? ??(??) (3.9) V. Average System Utilization for Channel(s) ? = Where M is the number of servers or channels ? ?(?) (3.18) VI. The Average Time Customers Wait in Line (??) ???? = VII. The Average Number of Customers in the System (Waiting and /or Being Served) ??= ??+ ? ? (3.10) ?? ? (3.19) ? (3.11) or (3.20) ? ? (3.12) ??= ?? × ? (3.21) VIII.The Average Time Spend in the System (Waiting in Line and Service Time) (??) ??= ??+ ? ?? ??= ?? IX. The System Capacity, Q Q = Μ? These formulas will be used in the waiting line analysis System Utilization per day = ? ?? (3.13) (3.13) ?= ?? ? (3.22) ? (3.23) ????? ??????? ???? ????? ??????? ???? = ?? ?? (3.24) @ IJTSRD | Available Online @ www.ijtsrd.com | Volume – 2 | Issue – 5 | Jul-Aug 2018 Page: 1290
International Journal of Trend in Scientific Research and Development (IJTSRD) ISSN: 2456-6470 The following results were obtained after substitutions of data collected into the formulas expressed in the previous sections. The table 3.1 above was computed using the data collected by the researcher in the previous chapter by substituting into the formula For day 1, the average arrival rate for 12 number of time interval for each of the three servers is given by ∑ ? /? ??? Where λ is the total number of arrivals in each server daily, and N is the number of time intervals and i = 1,2,3,4, etc. The average service rate for each of the servers is given by ∑ ? /? ??? Where µ is total number of customers being served per day and N the number of time intervals. Note: This applies to all the days and servers Using equations (14) and (15) above (chapter three), we have the results in the table below Table 3.1: Results of the Three Servers Analyses M ?? 1 0 2 0.836633 3 0.13863 4 0.050566 5 0.025538 6 0.015438 7 0.015245 8 0.007667 9 0.00595 4. Results and Discussions 4.1 Results 4.1.2 Graphical Representations of the Data From table 3.1 are the data for graphical representations as below: Figure 4.1: Server 1 Average Daily Arrival Rate ?? ?? Figure 4.2: Server - 1 Average Daily Service Rate ?? -0.18048 0.351096 0.48456 0.540665 0.56806 0.581313 0.586285 0.585774 0.58128 Figure 4.3: Server- 2 Average Daily Arrival Rate Figure 4.4: Server- 2 Average Daily Service Rate @ IJTSRD | Available Online @ www.ijtsrd.com | Volume – 2 | Issue – 5 | Jul-Aug 2018 Page: 1291
International Journal of Trend in Scientific Research and Development (IJTSRD) ISSN: 2456-6470 Table 4.1: Daily System Utilization for each Server Daily Record Server 1 Day 1 1.352941 1.235294 1.194245 Day 2 1.161765 1.192308 Day 3 1.182796 1.116071 1.102941 Day 4 1.171053 1.242991 1.136691 Day 5 1.103448 Server 2 Server 3 1.208 1.25 1.073171 Figure 4.5: Server 1 Average Daily Arrival Rate Figure 4.9: Graph of Daily System Utilization of the Three Servers The table above was computed out of the formula below in order to know how the system in each server is being utilized daily (see table 6 for data used). 4.1.3 Computations To compute for the customer’s arrival rate for the period of 5 days for each of the server we use the formula ? Figure 4.6: Server -3 Average Daily Service Rate ?? ? ??? Where; λ is the average arrival rates shown in table 3.1 above and n is the number of days. Customers arrival rate for server 1(λ1) = 9.083333 Customers arrival rate for server 2 (λ2) = 10.98333 Customers arrival rate for server 3 (λ3) = 12.61667 Average Customers arrival rate for the servers (λ) = 10.89444 For customers service rate for 5 days, we use ? Figure 4.7: Graph of the Three Servers Arrivals Rates ??/? ??? Where µ is the average service rates shown in table 6 above and n is the number of days Service Rate for Server 1(µ1) = 7.666667 Figure 4.8: Graph of the Three Servers Service Rates @ IJTSRD | Available Online @ www.ijtsrd.com | Volume – 2 | Issue – 5 | Jul-Aug 2018 Page: 1292
International Journal of Trend in Scientific Research and Development (IJTSRD) ISSN: 2456-6470 ? ??.????? ?(?.??????)=0.293739 Service Rate for Server 2(µ2) = 9.116667 Service Rate for Server 3(µ3) = 11.03333 Average Service Rate for the three Servers (µ) = 9.272222 The Average Number of Customers Being Served (R) ? = The average number of customers being served in servers (R) ??= ??= ??= ? = System Utilization for each Channel ? = ??= = ??= = ??= = ? = ? = ? = Expected Inter Arrival Time per Half Hour ? Expected Service Time per half hour = ? The Probability of Zero Units in the System Ρ?= 1 − Ρ?= 1 −??.????? The Probability of Three Units in the System Ρ?= Ρ??? Ρ?= 0.851096???.????? Expected Inter Arrival Time per Half Hour ? Service per Half Hour = ? = This is the time it will take for the customer to be served From the table above: M = 5, ??= 0.025871= 0.026 and ??= 0.569136 = 0.569 The average number of customers waiting for service (??) = 0.025871= 0.026 Average Waiting Time for an Arrival Not Immediately Served (??) (??) = (??) = ?(?)= (4.13) ? ??.????? ?(?.??????)=0.234991 (4.14) ?(?)= ? ??.????? ?(?.??????)=0.195826 ?(?)= (4.15) ? ? (4.1) ? ??.?????× 30 =2.753697 minutes ? = (4.16) (4.17) ?? ??= ?.?????? ?.??????= 1.184783 (4.2) ? ?= ?.?????? × 30 =3.23547minutes ?? ??= ??.????? ?.??????= 1.204753 (4.3) ? ? ?.?????? = 0.851096 (4.18) ?? ??= ??.????? ??.?????= 1.184783 (4.4) ? ?= ??.????? ?.??????=1.174955 (4.5) ? ?? (4.19) ? ? ?.??????? = 1.3805 ?(?) (4.6) ?? ?.?????? ?(?.??????)= 1.184783 (4.7) ??(??) ? ??.?????× 30 =2.753697 minutes (4.20) ? = ?? ??.????? ?(?.??????)= 1.204753 (4.8) ??(??) ? ? ?.??÷?? = ?.???= 9.2593 minutes (4.21) ?? ??.????? ?(??.?????)=1.143505 (4.9) ??(??) Figure 4.10: Bar Chart System Utilization for the Three Servers Average System Utilization for the Channel(s) ? = ? = ? = ? ??? ? (Using 5 servers) ? ?(?.??)???.??= 0.235 Half hour or 7.05 minutes (4.22) ? ??.????? ?(?.??????)=1.174955 ?(?)= (4.10) ? ??.????? ?(?.??????)=0.587478 ?(?)= (4.11) ? ??.????? ?(?.??????)=0.391652 ?(?)= (4.12) @ IJTSRD | Available Online @ www.ijtsrd.com | Volume – 2 | Issue – 5 | Jul-Aug 2018 Page: 1293
International Journal of Trend in Scientific Research and Development (IJTSRD) ISSN: 2456-6470 5. 5.1 Conclusion The evaluation of queuing system in an establishment is necessary for the good of the establishment. As it concerns the case study company, the evaluation or analysis of their queuing system shows that the case study company needs to increase the number of their channels or servers up to five (5) servers as shown in the result analysis. This will however attracts some cost to the establishment, but operations managers will be willing to allow some level of queue in their establishment, if it will not cost them losing their prospective customers. The increase in the number of servers will reduce the time customers wait as and at when due. 5.2 Contribution to Knowledge 1.It is possible to make analysis in any establishment where queuing and waiting are occurring to be resolved to remove the clog or bottleneck. 2.Identification of the service channels or servers required for any size of service establishment is now possible following the routine applied in this research format. 5.3Recommendation 1.Evaluation of queuing system in the establishment is necessary for the assessment of efficiency per time interval. 2.There is the need to increase the number of channels or servers up to five (5) servers in the current establishment to reduce the waiting time of customers. 3.Management should work out modality to increase the system capacity and system utilization which means high profitability. 4.This method of analysis can be used in other areas of applications such as in: bottle filling automatic machine, design of RGV system, wholesale goods transporting, loading and off loading stations and other aspects like these. REFERENCES 1.Adedayo A. O., Ojo, O. and Obamiro J. K. (2006) Operations Research in Decision Analysis and Production Management, Lagos, Pumark Nigeria Limited. 2.Adele, M and Barry S., (2005), Modeling Patient Flow in Hospital Using Queuing Theory, Unpublished Paper. Conclusion and Recommendation The Average Time Customers Wait in Line (??) ???? = 0.00239half hour or 0.072 minutes Probability that an Arrival will have to wait for Service (??) (??) = The Average Number of Customers in the System (Waiting and /or Being Served) ??= ??+ ? Or ??= ?? × ? Using Equation (25) above; ??= 0.026 + 1.2 = 1.226 The average time spend in the system (waiting in line and service time) (??) ??= ??+ ? ??= ?? System Utilization? = The System Capacity, Q = Μ? = 5 × 9.26 = 46.3 (4.28) 4.2. Discussion of Results From the analysis above, table 4.1shows the server’s daily utilization factor and all the calculated are above 100% (percent), which proved that the servers were over utilized, hence, the need to add more server. It was observed that number of servers necessary to serve the customers in the case study establishment was five (5) servers (or channels). This is the appropriate number of servers that can serve the customers as and at when due without waiting for long before customers are been served at the actual time necessary for the service. This increases in servers reduces the waiting time, and the probability that an arrival will have to wait for service is 0.01or 0.84min. However, the system utilization was calculated to be 0.235. Furthermore, the system capacity of the five servers was observed to be 46.3 for half an hour or 741persons served per day. ?? λ= ?.??? ??.??= ?? ??= ?.????? ?.???= 0.01 (4.23) (4.24) (4.25) ?= ?? ??.??= 0.113 Or 6.78mins ? (4.26) ?= ?.??? ? ??.?? ?(?.??)= 0.235 (4.27) ?(?)= @ IJTSRD | Available Online @ www.ijtsrd.com | Volume – 2 | Issue – 5 | Jul-Aug 2018 Page: 1294
International Journal of Trend in Scientific Research and Development (IJTSRD) ISSN: 2456-6470 3.Adeleke A. R., AdebiyiC. E. and Akinyemi O. (2005) Application of Queuing Theory to Omega Bank Plc, Ado Ekiti, International Journal of Mathematics, 1(122): 129. 4.Arnodu M. D, Rossum A. C., Visser M. C. and Koole G. M., (2006) Modeling the Emergency Cardiac In-patient Flow: An Application of Queuing Theory Revised Manuscript. 5.Arnodu M. D, Rossum A. C., Visser M. C. and Koole G. M., (2006) “Bottleneck Analysis Emergency Cardiac University: An Application of Queue Theory” Invest Med, 28,(6), 316 - 317 6.Arnodu M. De Bruin, (2004) “Patient Flow and Resource Allocation in Hospitals: A Quantitative Approach”, Outline of PhD Thesis. 7.Cahill W and Render M (1999)” Dynamic Simulation Modeling of ICU Bed Availability”, Proceeding of the 1999 Winter Simulation Conference, pp 1563 – 1570. 8.Cochran K. J. and Bharti, A, (2006) “A Multi – Stage Stochastic Methodology for whole Hospital Bed Planning under Peak Loading” International Journal of Industrial and Systems Engineering, 1 (1/2): 8 – 35. 9.Cooper R. B. (1972) Introduction of Queue Theory, New York Macmillan 10.Creemer S. and Labrecht M. R.(2007), “Modeling a Healthcare System as a Network: The Case of Belzian Hospital”. A Paper Submitted to Department of Decision Science and Information Management, Research Centre of Operation and Management, Katholieke University Leuven. 11.Davis M. M, Aquilano J. N. and Chase B. R, (2003), Fundamentals of Operations Management, Boston McGraw-Hill Irwin 12.Derlet R. and Richards J. (2000), Overcrowding in the Nation’s Emergency Departments: Complex Causes and Distributing Emergency Medicare, 35 (1), pp 63-68 13.Dshalalow, J. H. (1997), “Queuing System with State Department Parameters in Frontiers in Queuing” CRC Press, Boca Raton, 61-116 14.Fernandes, C. M., Price A., Christenson J. M., (1997), Does Reduced Length of Stay Decrease the Number Of Emergency Department Patients who Leave Without Seeing Physician”, Journal of Emergency Medical, 15: 397-399 15.Green V. L., Soares J., Guilio J., and Green R.,(2006), “Using Queue Theory to Increase the Effectiveness of Emergency Department Provides Staffing”, Academic Emergency Medicine,13 (1): 61- 68 16.Harry Peros “Stability Conditions”, Service Management. 17.Henry M. C.,(2001), “Overcrowding in America’s Emergency Department In-patient Wards Replace Emergency Care” Medicine, 8 (2): 151- 155 18.Hiller F. S. and Boling R. W. (10967), “Finite Queues in Series with Exponential or Erlang Service Times – Operations Research, 15: 285-303 19.Hiller S. F., and Lieberman J. G. (2001), Introduction to Operations Research, Boston: McGraw Hill, Seventh Edition 20.Hiller S. F., and Lieberman J. G. (2005), Introduction to Operations Research, Boston: McGraw Hill, Seventh Edition 21.Hiller S. F and Hiller S. M., (2003), Introduction to Management Science; A Model and Case Study Approach with Spreadsheets, Boston: McGraw Hill Irwin Second Edition 22.Hoover S. and Ronald P., (1990), Simulation: A Problem Solving Approach, Reading, MA: Addison-Wesley. 23.Kendall, D. G. (1951), Some Problems in the Theory of Queues”, J. R. S. S. B. 13: 151-185 24.Kendall, D. G. (1951), Stochastic Processes in the Theory of Queues and their Analysis by the Method of Imbedded Markov Chains, Ann Math. Statist, 24, 338-354. 25.Kim S., Horowitz I., Young K. and Buckly, T. (1999), “Analysis of Capacity Management of the Intensive Care Unit in a Hospital”, European Journal of Operations Research, 105: 346-355 26.Koizumi, N.,(2002), “A Queuing Analysis with Blocking: Analysis of Congested Flows in mental Health Systems” Regional Science University of Pennsylvania 27.Krajewski L. J. and Ritzman L., (1998), Operations Management: Strategy and Analysis, In-patient Flow in a Academic Emergency A Numerical Approach” Effects”, Annual @ IJTSRD | Available Online @ www.ijtsrd.com | Volume – 2 | Issue – 5 | Jul-Aug 2018 Page: 1295
International Journal of Trend in Scientific Research and Development (IJTSRD) ISSN: 2456-6470 New York: Addison Wesley Longman Publishers, 5th Edition 28.Kuno E., Koizumi, N., Rothberd, B. A, Green ward J.(2007), “A Secure System Planning Model for Individual with Serious Mental Illness”, Unpublished Paper. 29.Lapin L. L., (1981), Quantitative Method for Business Decision, Harcourt: B. Jouanaurch, 2nd Edition. 30.Liturk N., RijbergenV. M., Boucherner,J. R.,and Houdenhouen V. M., (2006) “Managing the Overflow of Intensive Care Patients”, Unpublish Manuscript 31.Macmanus M. C., Cooper A. B and Litvak E., (2004) “Queuing Theory Accurately Models the Need for Critical Anesthesiology, Vol. 100 No5, pp1271- 1276 32.Medhi J, (2003) Stochastic Models in Queuing Theory, Amsterdam: Academic Press, Second Edition 33.Obamiro, J. K., (2003) “Application of Queuing Model in Determining the Optimum Number of Service Facilities in Nigerian Hospitals” M Sc. Project Submitted to Department of Business Administration, University of Ilorin 34.Ozcan Y. A., (2006), quantitative Method in Health Care Management; Techniques and Application Publications 35.Prem K. G. and Hira D. S., (2008) “Operations Research”, Queuing Models 36.Shmueli A., Springe C. and Kaplan, E. (2003) “Optimizing Admissions to an Intensive Care Unit” Health Management Science, 6: 113-136 37.Singh V.,(2007) “Use of Queuing Models in Health Care” Department of Health Policy and Management, University of Arkansas for Medical Sciences. 38.Smith D. and Mayhew L., (2008) Using Queuing Theory to Analyze Governments 4-h Completion Time Target in Accident and Emergency Departments, Health Care Management Science, 11: 11- 21. 39.Taha A. H., (2002) Operations Research: An Introduction, Delhi: Pearson Prentice Hall, Seventh Edition 40.Takagi H. (1991) “Queuing Analysis, A Foundation of Performance Evaluation”, Vocation and Priority Systems 1, 10 – 19. 41.Takagi H. and Boguslavsky L. B., (1991) “A Supplementary Bibliography on Queuing Analysis and Performance Evaluation” Queuing Systems, 8, 313 – 322 Publications, Jossey- Bass Care Resources” @ IJTSRD | Available Online @ www.ijtsrd.com | Volume – 2 | Issue – 5 | Jul-Aug 2018 Page: 1296