Download
1 / 7
70 likes | 76 Vues
The objective of the study is to try to indicate that political capital is as important as other capitals if not the controller of other capitals. Data from social ecological survey was analysed after entry in to statistical package for social sciences to get the respondents' views of livelihood capitals. The majority of the respondents 58.5 in Yaaku community indicated that politicians addressed issues of climate change in the community, with only 18.3 and 30.8 of them said that climate change issues were addressed by professionals and administrators respectively. However similar respondent of opinion of 45.4 , 35.4 and 17.9 said it was politicians, professionals and administrators who address development issues respectively. The majority 70.4 of the respondents gave their opinion that politicians and other leaders do not understand climate related risks on livelihoods while a small minority 29.6 were on the opinion that the politicians and other leaders understood climate related risks on the livelihoods in pastoral communities. Politicians being the main decision makers on development issues in local set up in developing countries where Kenya is one of them, decisions on climate change and adaption need be discussed and understood by politicians. Therefore policy formulation is needed as from county and national level on how to mainstream politicians in issues of climate change and adaptations. Therefore the politicians were key in addressing the impacts of climate change although they had not known or understood that the impacts are of climate change but either campaign goodies or development agenda. Therefore to address climate change impacts and their adaptations strategies political angle need be applied which makes political influence capital a main livelihood capital in addressing issues of climate change. Kiambi Gilbert M'mboroki | Shem Wandiga | Silas OdongoOriaso "Political influence as a main Livelihood capital addressing climate change impacts of Yaaku Community of Laikipia County - Kenya" Published in International Journal of Trend in Scientific Research and Development (ijtsrd), ISSN: 2456-6470, Volume-1 | Issue-6 , October 2017, URL: https://www.ijtsrd.com/papers/ijtsrd2461.pdf Paper URL: http://www.ijtsrd.com/other-scientific-research-area/other/2461/political-influence-as-a-main-livelihood-capital-addressing--climate-change-impacts--of-yaaku-community-of-laikipia-county---kenya/kiambi-gilbert-m'mboroki<br>

E N D
International Research Research and Development (IJTSRD) International Open Access Journal Political Influence as a Main Livelihood Capital Addressing Climate Change Impacts of Yaaku Community of Laikipia County - Kenya International Journal of Trend in Scientific Scientific (IJTSRD) International Open Access Journal ISSN No: 2456 ISSN No: 2456 - 6470 | www.ijtsrd.com | Volume www.ijtsrd.com | Volume - 1 | Issue – 6 Political Influence Addressing Climate Change Impacts Community Main Livelihood Capital f Yaaku Kenya Kiambi Gilbert M’mboroki Shem Wandiga Silas OdongoOriaso Silas OdongoOriaso Ministry of Agriculture, Livestock Development and Fisheries (State department of livestock) University Nairobi (Institute of climate change and adaptation) University Nairobi (Institute of University Nairobi (Institute of climate change and adaptation) climate change and adaptation) the politicians were key in addressing the impacts of climate change although they had not known or understood that the impacts are of climate change but either campaign goodies or development agenda. Therefore to address climate change impacts and their adaptations strategies political angle need be applied which makes political influence capital a mai livelihood capital in addressing issues of climate change. ABSTRACT The objective of the study is to try to indicate that political capital is as important as other capitals if not the controller of other capitals. Data from social ecological survey was analysed after entry in to statistical package for social sciences to get respondents’ views of livelihood capitals. The majority of the respondents 58.5% in Yaaku community indicated that politicians addressed issues of climate change in the community, with only 18.3% and 30.8% of them said that climate change issues were addressed by professionals and administrators respectively. However similar respondent of opinion of 45.4%, 35.4% and 17.9% said it was politicians, professionals and administrators development issues respectively. The majority 70.4% of the respondents gave their opinion that politicians and other leaders do not understand climate related risks on livelihoods while a small minority 29.6% was on the opinion that the politicians and other leaders understood climate related risks on the livelihood pastoral communities. Politicians being the main decision makers on development issues in local set up in developing countries where Kenya is one of them, decisions on climate change and adaption need be discussed and understood by politicians. Theref policy formulation is needed as from county and national level on how to mainstream politicians in issues of climate change and adaptations. Therefore issues of climate change and adaptations. Therefore objective of the study is to try to indicate that political capital is as important as other capitals if not the controller of other capitals. Data from social ecological survey was analysed after entry in to statistical package for social sciences to get the respondents’ views of livelihood capitals. The majority of the respondents 58.5% in Yaaku community indicated that politicians addressed issues of climate change in the community, with only 18.3% and 30.8% of them said that climate change issues addressed by professionals and administrators respectively. However similar respondent of opinion of 45.4%, 35.4% and 17.9% said it was politicians, professionals and administrators development issues respectively. The majority 70.4% spondents gave their opinion that politicians and other leaders do not understand climate related a small minority 29.6% was on the opinion that the politicians and other leaders understood climate related risks on the livelihoods in pastoral communities. Politicians being the main decision makers on development issues in local set up in developing countries where Kenya is one of them, decisions on climate change and adaption need be discussed and understood by politicians. Therefore policy formulation is needed as from county and national level on how to mainstream politicians in the politicians were key in addressing the impacts of they had not known or understood that the impacts are of climate change but either campaign goodies or development agenda. Therefore to address climate change impacts and their adaptations strategies political angle need be applied which makes political influence capital a main livelihood capital in addressing issues of climate Keywords: Political capital, livelihoods, climate change adaptations, impacts, Yaaku change adaptations, impacts, Yaaku : Political capital, livelihoods, climate 1.INTRODUCTION who who address address As indicated by [1] the livelihood capital are “natural (environmental) capital: which is natural resources (land, water, wildlife, biodiversity, environmental resources). Second physical capital: which is basic infrastructure (water, sanitation, energy, t communications), housing and the means and equipment of production. Third human capital: which is health, knowledge, skills, information and ability to labour. Fourth social capital: which resources (relationships of trust, members groups, networks, access to wider institutions). And lastly financial capital: which is financial resources available (regular remittances or pensions, savings, supplies of credit)”.Therefore the essence of policies, supplies of credit)”.Therefore the essence of policies, As indicated by [1] the livelihood capital are “natural (environmental) capital: which is natural resources (land, water, wildlife, biodiversity, environmental resources). Second physical capital: which is basic infrastructure (water, sanitation, energy, transport, and communications), housing and the means and equipment of production. Third human capital: which is health, knowledge, skills, information and ability to labour. Fourth social capital: which are social (relationships of trust, membership of groups, networks, access to wider institutions). And lastly financial capital: which is financial resources available (regular remittances or pensions, savings, @ IJTSRD | Available Online @ www.ijtsrd.com @ IJTSRD | Available Online @ www.ijtsrd.com | Volume – 1 | Issue – 6 | Sep - Oct 2017 Oct 2017 Page: 43
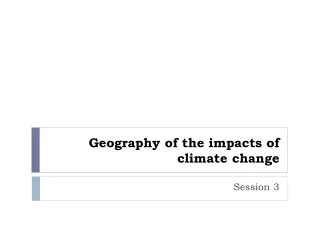
International Journal of Trend in Scientific Research and Development (IJTSRD) ISSN: 2456-6470 processes and institutions cannot be overemphasized, because they engage at all levels, from the family to the international arena, and in all spheres, from the most public to the most private[2]. They in a big way determine access (to various types of capital, to decision-making bodies to source of influence and livelihood strategies), returns to any given livelihood strategy and terms of exchange between different types of capitals [2]. Whether people are able to achieve a feeling of inclusion and well-being, there is a direct impact on policies, institutions and processes. Because culture is inclusive in this area they also account for other ‘unexplained’ variability in the ‘way things are done’ in different societies [2]. Decision making processes and access to assets can be greatly determined by policies, institutions and processes. The policies, institutions and processes are here referred to as political influence or capital. Figure 1 below shows the mukogodo East ward where Yaaku community resides in mukogodo forest. Figure 1: A map of Laikipia County showing the mukogodo East Ward to pick numbers of households (actually about 30 percent of households) from each village[6]. Then Methodology The study population comprised of 800 households in Mukogodo and Sieku locations in Mukogodo East ward while the sampling frame, from which the study sample was drawn constituted all the households living in the nine villages of these two locations. The unit of analysis was the household and the subject of analysis (the respondent) was the head of the household or their representative. random sampling was undertaken among the systematically selected households in each village, to constitute a study sample of 240 households. Two formulae from [8], and [7] were used for computing the study sample size, but yielded rather large sample sizes that could not be sustained by the available resources for the study. According to [7], a minimum of 100 is recommended for a survey research and gives a reasonable unit for analysis. In each of the nine villages, a list of the households was compiled during the process of community managed disaster and risk reduction (CMDRR) as used by[3], [4], [5], and systematic sampling was used @ IJTSRD | Available Online @ www.ijtsrd.com | Volume – 1 | Issue – 6 | Sep - Oct 2017 Page: 44
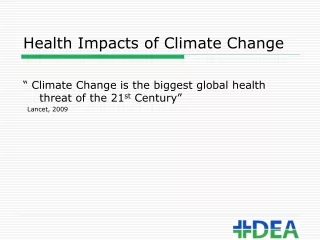
International Journal of Trend in Scientific Research and Developm International Journal of Trend in Scientific Research and Development (IJTSRD) ISSN: 2456 ent (IJTSRD) ISSN: 2456-6470 [6] Indicated that at least 30% of the total population is representative. Thus, 30% of the accessible population is enough for the sample size. Thus in this study 30% of 800 households was (240) respondents. study 30% of 800 households was (240) respondents. Indicated that at least 30% of the total population Data from social ecological survey was analysed after entry in to Statistical Package for Social Sciences to get the respondents’ views of land 1986 to 2015. Data from social ecol analysed after entry in to Statistical Package for Social Sciences to get the respondents’ views of use and management within the three decades. within the three decades. % of the accessible population is enough for the sample size. Thus in this Hence resorting to the provisions of the Statistical Package for the Social Sciences programme, which suggest that any sample size of 200 and above will allow perfect functioning of all the analytical procedures provided by the programme. procedures provided by the programme. ng to the provisions of the Statistical Package for the Social Sciences programme, which suggest that any sample size of 200 and above will allow perfect functioning of all the analytical Results and discussions Changes in trends in Member of Parliament influence for last three decades Member of Parliament influence Figure 2 changes in trend in Member of Parliament Figure 2 changes in trend in Member of Parliament influence. A socio-ecological survey using a structured questionnaire was used to collect respondent’s opinion on climate changes and adaptation on land use and management in specific based on livelihood capitals (social capital) for last three decades as from capitals (social capital) for last three decades as from g a structured questionnaire was used to collect respondent’s opinion on climate changes and adaptation on land use and management in specific based on livelihood 100% 45.6% 60.4% 94.2% 97.7% decreasing 54.4% 39.6% 5.8% 2.3% increasing 0% members of the parliament influence now members of members of the parliament influence 10 years ago members of the parliament influence 20 years ago members of the parliament influence 30 years ago parliament influence 10 years ago Figure 2: Changes in trends in Member of Parliament influence the last three decades Figure 2: Changes in trends in Member of Parliament influence the last three decades Figure 2: Changes in trends in Member of Parliament influence the last three decades As indicated by Figure 2, the majority (97.7%) of the respondents gave their opinion that the trend Member of Parliament was low in last thirty years than now and that the Member of Parliament influence had increased and that average majority (54.4%) had the same opinion that the trend in Member of Parliament influence had increased by now as compared to last three decades. In depth discussion at focus group and key informants the issue of low influence in the last thirty and twenty years was associated with marginalisation of the community due low population igure 2, the majority (97.7%) of the respondents gave their opinion that the trend Member of Parliament was low in last thirty years than now and that the Member of Parliament influence had increased and that average majority (54.4%) had the hat the trend in Member of Parliament influence had increased by now as compared to last three decades. In depth discussion at focus group and key informants the issue of low influence in the last thirty and twenty years was associated with of the community due low population and also luck of their own in the representation. and also luck of their own in the representation. Changes in trends in president of the republic Changes in trends in president of the republic influence for the last three decades influence for the last three decades Figure 3 below shows changes in president of the Figure 3 below shows changes in president of the republic influence @ IJTSRD | Available Online @ www.ijtsrd.com @ IJTSRD | Available Online @ www.ijtsrd.com | Volume – 1 | Issue – 6 | Sep - Oct 2017 Oct 2017 Page: 45
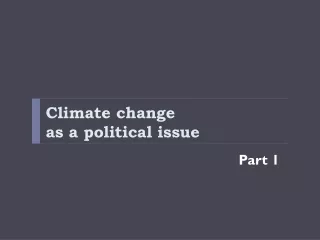
International Journal of Trend in Scientific Research and Developm International Journal of Trend in Scientific Research and Development (IJTSRD) ISSN: 2456 ent (IJTSRD) ISSN: 2456-6470 15.9% 100% 33.5% 80% 62.6% 67.3% 60% 84.1% 66.5% 40% decreasing 37.4% 32.7% 20% 0% increasing President of the republic influence now President of the republic influence 10 years ago years ago President of the republic influence 10 President of the republic influence 20 years ago President of the republic influence 30 years ago Figure 3: Changes in trends in president of the republic influence the last three decades Figure 3: Changes in trends in president of the republic influence the last three decades Figure 3: Changes in trends in president of the republic influence the last three decades As indicated by Figure3, the majority (67.3%) of the respondents gave their opinion that the trend in the influence of the President of the Republic was low in last thirty years than now and that the trend in the President of the Republic had increased and majority (84.1%) had the same opinion that the trend in the President of the Republic had increased by now as compared to last three decades. In depth discussion at focus group and key informants the issue of low influence in the last thirty and twenty years was associated with marginalisation of the community due low population which had negligible impact in low population which had negligible impact in As indicated by Figure3, the majority (67.3%) of the respondents gave their opinion that the trend in the influence of the President of the Republic was low in last thirty years than now and that the trend in the President of the Republic had increased and that the majority (84.1%) had the same opinion that the trend in the President of the Republic had increased by now as compared to last three decades. In depth discussion at focus group and key informants the issue of low political sphere, which lead to negligible address of political sphere, which lead to negligible address of climatic related mitigation measures. climatic related mitigation measures. Who address the issues of climate change and Who address the issues of climate change and adaptation in the community Figure 4 below shows who addresses the issues of Figure 4 below shows who addresses the issues of climate change and adaptations in the community climate change and adaptations in the community twenty years was associated with marginalisation of the community due Who addressed the issues of climate change and adaptation in the Who addressed the issues of climate change and adaptation in the community Who addressed the issues of climate change and adaptation in the 100.0 Who addressed the issues of climate change and adaptation in the Who addressed the issues of climate change and adaptation in the community 50.8 30.8 50.0 18.3 0.0 proffessionals Administrators Administrators politicians Figure 4: Who addresses the issues of climate change and adaptation Figure 4: Who addresses the issues of climate change and adaptation in the community in the community As indicated in Figure 4, the majority of the respondents (58.5%) in Yaaku community indicated that politicians addressed issues of climate change in the community, with only 18.3% and 30.8% of them said that climate change issues were a professionals and administrators Therefore the politicians were key in addressing the impacts of climate change although they had not impacts of climate change although they had not As indicated in Figure 4, the majority of the respondents (58.5%) in Yaaku community indicated that politicians addressed issues of climate change in the community, with only 18.3% and 30.8% of them said that climate change issues were addressed by professionals and administrators Therefore the politicians were key in addressing the or understood that the impacts are of climate change but either campaign goodies or development known or understood that the impacts are of climate change but either campaign goodies or development agenda (figure 6) Who address development issues and agenda in the Who address development issues and agenda in the community? respectively. respectively. Figure 5 below shows who addresses development Figure 5 below shows who addresses development issues in the community @ IJTSRD | Available Online @ www.ijtsrd.com @ IJTSRD | Available Online @ www.ijtsrd.com | Volume – 1 | Issue – 6 | Sep - Oct 2017 Oct 2017 Page: 46
International Journal of Trend in Scientific Research and Development (IJTSRD) ISSN: 2456-6470 Who addresses development issues and agenda in the community 60.0 Who addressed development issues and agenda in the community 45.4 35.4 40.0 17.9 20.0 0.0 Politicians Administration Professionals Figure 5: Who addresses the development agenda in the community. As indicated by Figure 4.56 where almost similar opinion of 45.4%, 35.4% and 17.9% said it was politicians, professionals respectively. Therefore the politicians were key in addressing the impacts of climate change although they had not known or understood that the impacts are of climate change but either campaign goodies or development agenda Do politicians or leaders understand climate related risks on livelihoods? and administrators Figure 6 below shows who understands climate related risks on livelihoods among politicians and other leaders. Do politicians/leaders understood climate-related risks on livelihoods? Do politicians/leaders understood climate-related risks on livelihoods? 100.0 70.4 29.6 50.0 0.0 Yes No Figure 6: Who understands climate-related risks on livelihoods among politicians and other leaders? As indicated in Figure 6, the majority (70.4%) of the respondents gave their opinion that politicians and other leaders do not understand climate related risks on livelihoods while a small minority (29.6%) were on the opinion that the politicians and other leaders understood climate related risks on the livelihoods in pastoral communities. Figure 7 below shows summary of political capital (increasing) 120.0% 100.0% 80.0% increasing 60.0% 40.0% decreasing 20.0% 0.0% members of … members of … members of … members of … county … county … women … women … members of … members of … President of … President of … 2 per. Mov. Avg. (increasing ) Figure 7: Summary of changes in political capital for the last three decades (increasing) @ IJTSRD | Available Online @ www.ijtsrd.com | Volume – 1 | Issue – 6 | Sep - Oct 2017 Page: 47
International Journal of Trend in Scientific Research and Development (IJTSRD) ISSN: 2456-6470 As indicated by Figures 7, the opinion on trend of selected political capitals or assets of the respondent of the forested pastoral ecosystem of Mukogodo, home of Yaaku community the trend was increasing in member of county assembly influence, member of parliament influence, county government governor influence, county women representative influence, member of senate influence and President of the republic influence were less in last three decade and increased progressively to present day. This is due to change in governance after the implication of the new constitution few years ago. Figure 8 below shows summary of political capital (decreasing) 120.0% 100.0% 80.0% 60.0% 40.0% increasing 20.0% decreasing 0.0% 2 per. Mov. Avg. (decreasing ) Figure 8: Summary of changes in political capital for the last three decades (decreasing) As indicated in Figure 8, there was a decreasing influence because some of the political offices like the member of county assembly, county women representative, governor and member of senate were associated with government devolution status coming into being last ten years, thus their offices were not operational in the last thirty and twenty years. However last thirty and twenty years was associated with marginalisation of the community due to low population which had negligible impact in political sphere, which lead to negligible address of climatic related mitigation measures by the political offices of those days. climatic variability and (context seasonal shocks) on smallholder livelihood assets portfolios are shaped by political influence. Politicians are the main decision makers on development issues in local set up in developing countries where Kenya is one of them. The political influence has increased over the period of thirty years mostly of the Member of Parliament and Presidency. However last thirty and twenty years was associated with marginalisation of the community due to low human population which had negligible impact in political sphere, which lead to negligible address of climatic related mitigation measures by the political offices of day. The political sphere seemed to be the main delivery of adaptations and other issues of climate change. The behaviour of political capital unlike other social capitals such as (networking, conservation groups, and stock friendship) which CONCLUSION In this study we adopted the [9] sustainable livelihood frame work with modifications to demonstrate how @ IJTSRD | Available Online @ www.ijtsrd.com | Volume – 1 | Issue – 6 | Sep - Oct 2017 Page: 48
International Journal of Trend in Scientific Research and Development (IJTSRD) ISSN: 2456-6470 decreased influence as from three decades to date. Political capital increased influence on climate change and adaptation issues. These findings are in conflict with the paradigm shift of top bottom to bottom up. This can be explained by luck of political involvement of the community and generally awareness to issues of climate change and adaptation and also physical distance between the community and the political class. In case of Yaaku community, low human capital in form of education and minority in numbers as led the forested pastoral community to luck political commitment within the community set up. Development. http://www.livelihoods.org/info/info guidancesheets.html (accessed: 23.07.2008) [3] Abdi and cord aid (2011): Technical brief; community managed disaster risk reduction (CMDRR); cord aids strategy for building resilience communities in dry lands areas of east and the horn http://www.disasterriskreduction.net/east-central Africa/reglap 20-08-2015, 4.45pm of Africa. [4] IIRR and Cord aid. (2013): Building resilient communities. A training manual on community managed disaster risk reduction, Philippines http://www.disasterriskreduction.net/east-central- africa/reglap 20-08-2015, 4.50pm RECOMMENDATIONS Decisions on climate change and adaption need be discussed and understood by politicians and other leaders. Therefore policy formulation is needed as from county level and national level on how to mainstream politicians in issues of climate change and adaptations. Capacity building of the community is recommended on group dynamics and importance in the community. [5] CARE International. (2015): Resilience in the rangelands: Changes and challenges for pastoral communities in Kenya and Ethiopia. www.care climate change.org.10-06-2015, 9.47 am their [6] Borg, W. R., & Gall, M. D. (2003): Educational Research: An Introduction (Fifth Ed.). New York: Longman. That the community is recommended to have organised groups (environmental committee) as suggested by [10] to address conservation, political and vulnerability issues in the pastoral forested ecosystem management [7] Kathuri, N. J. and Pals, D.A. (1993). Introduction to education research. Egerton University, Njoro Kenya. To fast truck increase in political capital for example ( member of county assembly, member of parliament, member of national senate, women representative, County governor and the presidency): Affirmative consideration of non-populous communities in decision making, resources allocation and human resource deployment and involvement of politicians in all issues of climate change and adaptation) [8] Mugenda Olive M. and Mugenda A.G, (1999).Research methods: Quantitative and Qualitativeapproaches. technology. African Centre for [9] DFID. (1999): Sustainable livelihoods guidance sheets www.eldis.org/vfile/upload/1/document/0901/sect ion2.pdf. 20-08-2015, 4.00pm section 2 REFERENCES [10] SjoholmHakanand Traditional pastoral communities securing green pastures through management: a case study from Kiteto District, United Republic of international workshop on participatory forestry in Africa pp 131-151;www.fao.org/3/a- y4807b/Y4807B11.pdf .04-02-2017 10.12 pm ShabaniLuono(1995): [1]Mcleod, R. (2001): The impact of regulations & procedures on the livelihoods & asset base of the urban poor; homeless www.r4d.afid.gov.uk/pdf/output/R78501.pdf 10- 05-2016 12.30am. participatory forest international, Tanzania: Second [2] DFID.(2000): Sustainable Livelihoods Guidance Sheets. Department for International @ IJTSRD | Available Online @ www.ijtsrd.com | Volume – 1 | Issue – 6 | Sep - Oct 2017 Page: 49