Download
1 / 12
120 likes | 124 Vues
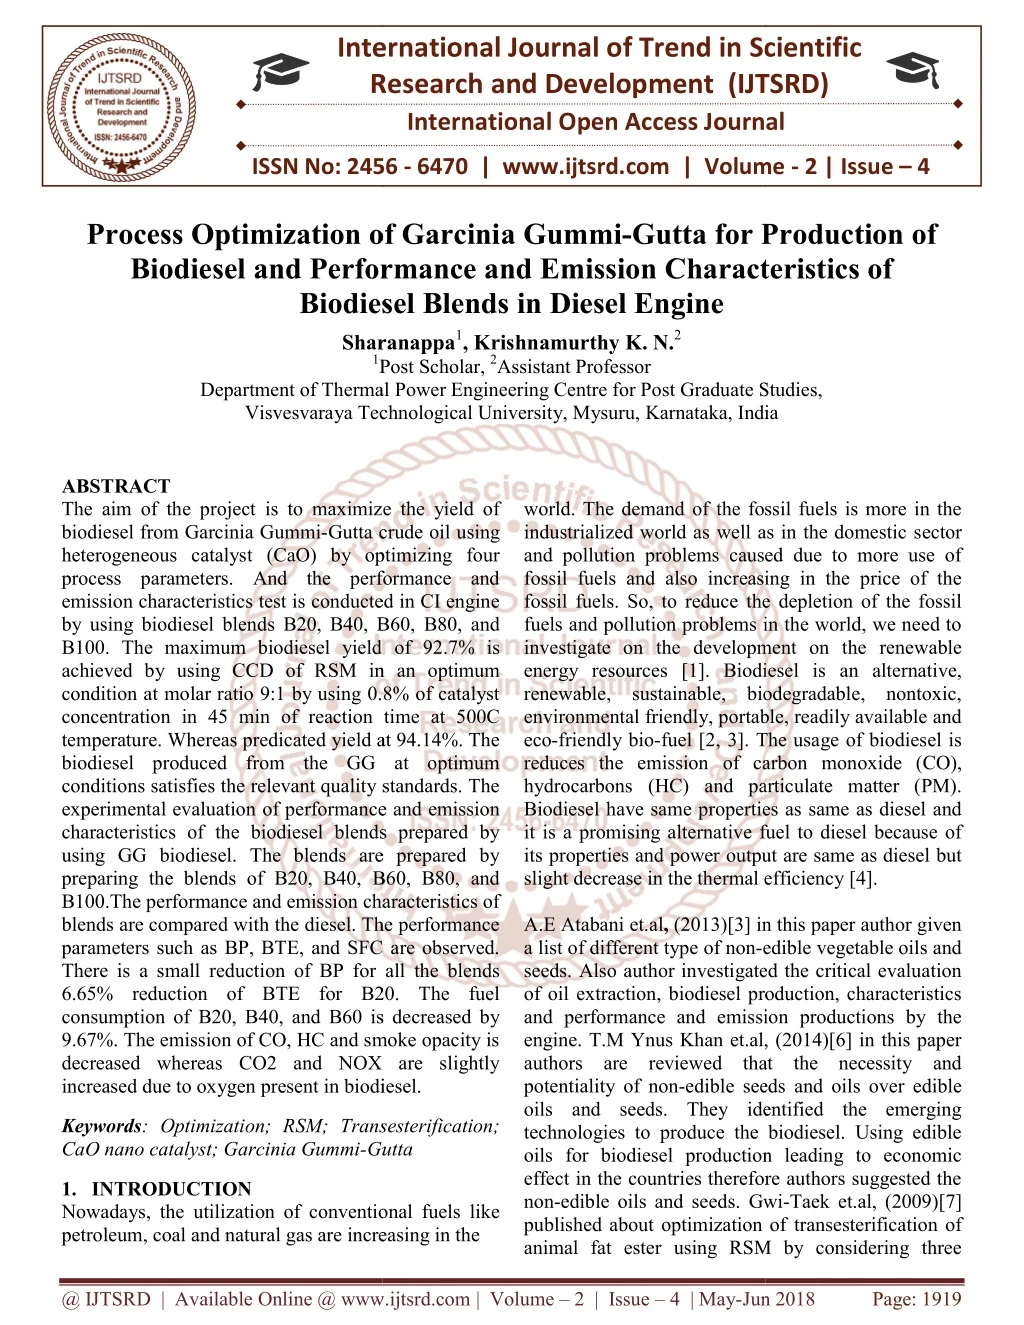
The aim of the project is to maximize the yield of biodiesel from Garcinia Gummi Gutta crude oil using heterogeneous catalyst CaO by optimizing four process parameters. And the performance and emission characteristics test is conducted in CI engine by using biodiesel blends B20, B40, B60, B80, and B100. The maximum biodiesel yield of 92.7 is achieved by using CCD of RSM in an optimum condition at molar ratio 9 1 by using 0.8 of catalyst concentration in 45 min of reaction time at 500C temperature. Whereas predicated yield at 94.14 . The biodiesel produced from the GG at optimum conditions satisfies the relevant quality standards. The experimental evaluation of performance and emission characteristics of the biodiesel blends prepared by using GG biodiesel. The blends are prepared by preparing the blends of B20, B40, B60, B80, and B100.The performance and emission characteristics of blends are compared with the diesel. The performance parameters such as BP, BTE, and SFC are observed. There is a small reduction of BP for all the blends 6.65 reduction of BTE for B20. The fuel consumption of B20, B40, and B60 is decreased by 9.67 . The emission of CO, HC and smoke opacity is decreased whereas CO2 and NOX are slightly increased due to oxygen present in biodiesel. Sharanappa | Krishnamurthy K. N. "Process Optimization of Garcinia Gummi-Gutta for Production of Biodiesel and Performance and Emission Characteristics of Biodiesel Blends in Diesel Engine" Published in International Journal of Trend in Scientific Research and Development (ijtsrd), ISSN: 2456-6470, Volume-2 | Issue-4 , June 2018, URL: https://www.ijtsrd.com/papers/ijtsrd14467.pdf Paper URL: http://www.ijtsrd.com/engineering/mechanical-engineering/14467/process-optimization-of-garcinia-gummi-gutta-for-production-of-biodiesel-and-performance-and-emission-characteristics-of-biodiesel-blends-in-diesel-engine/sharanappa<br>

E N D
International Research Research and Development (IJTSRD) International Open Access Journal International Journal of Trend in Scientific Scientific (IJTSRD) International Open Access Journal ISSN No: 2456 ISSN No: 2456 - 6470 | www.ijtsrd.com | Volume 6470 | www.ijtsrd.com | Volume - 2 | Issue – 4 Process Optimization of Garcini Biodiesel and Performance and Emission Characteristics of Biodiesel Blends in Diesel Engine Sharanappa 1Post Scholar Department of Thermal Power Engineering Centre for Post Graduate Studies, Visvesvaraya Technological Visvesvaraya Technological University, Mysuru, Karnataka, India Process Optimization of Garcinia Gummi-Gutta for Production of Biodiesel and Performance and Emission Characteristics of Biodiesel Blends in Diesel Engine Sharanappa1, Krishnamurthy K. N.2 Post Scholar, 2Assistant Professor Department of Thermal Power Engineering Centre for Post Graduate Studies, Department of Thermal Power Engineering Centre for Post Graduate Studies, Gutta for Production of Biodiesel and Performance and Emission Characteristics of , Karnataka, India world. The demand of the fossil fuels is more in the industrialized world as well as in the domestic s and pollution problems caused due to more use of fossil fuels and also increasing in the price of the fossil fuels. So, to reduce the depletion of the fossil fuels and pollution problems in the world, we need to investigate on the development on the energy resources [1]. Biodiesel is an alternative, renewable, sustainable, biodegradable, nontoxic, environmental friendly, portable, readily available and eco-friendly bio-fuel [2, 3]. The usage of biodiesel is reduces the emission of carbon mon hydrocarbons (HC) and particulate matter (PM). Biodiesel have same properties as same as diesel and it is a promising alternative fuel to diesel because of its properties and power output are same as diesel but slight decrease in the thermal ef A.E Atabani et.al, (2013)[3] in this paper author given a list of different type of non-edible vegetable oils and seeds. Also author investigated the critical evaluation of oil extraction, biodiesel production, characteristics and performance and emission productions by the engine. T.M Ynus Khan et.al, (2014)[6] in this paper authors are reviewed that the necessity and potentiality of non-edible seeds and oils over edible oils and seeds. They identified the emerging technologies to produce the biodiesel. Using edible oils for biodiesel production leading to economic effect in the countries therefore authors suggested the non-edible oils and seeds.Gwi published about optimization of animal fat ester using RSM by considering three animal fat ester using RSM by considering three ABSTRACT The aim of the project is to maximize the yield of biodiesel from Garcinia Gummi-Gutta crude oil using heterogeneous catalyst (CaO) by optimizing four process parameters. And the performance and emission characteristics test is conducted in CI engine by using biodiesel blends B20, B40, B60, B80, and B100. The maximum biodiesel yield achieved by using CCD of RSM in an optimum condition at molar ratio 9:1 by using 0.8% of catalyst concentration in 45 min of reaction time at 500C temperature. Whereas predicated yield at 94.14%. The biodiesel produced from the GG at optimum conditions satisfies the relevant quality standards. The experimental evaluation of performance and emission characteristics of the biodiesel blends prepared by using GG biodiesel. The blends are prepared by preparing the blends of B20, B40, B60, B80, and B100.The performance and emission characteristics of blends are compared with the diesel. The performance parameters such as BP, BTE, and SFC are observed. There is a small reduction of BP for all the blends 6.65% reduction of BTE for B20. The fuel consumption of B20, B40, and B60 is decreased by 9.67%. The emission of CO, HC and smoke opacity is decreased whereas CO2 and NOX are slightly increased due to oxygen present in biodiesel. increased due to oxygen present in biodiesel. The aim of the project is to maximize the yield of world. The demand of the fossil fuels is more in the industrialized world as well as in the domestic sector and pollution problems caused due to more use of fossil fuels and also increasing in the price of the fossil fuels. So, to reduce the depletion of the fossil fuels and pollution problems in the world, we need to investigate on the development on the renewable energy resources [1]. Biodiesel is an alternative, renewable, sustainable, biodegradable, nontoxic, environmental friendly, portable, readily available and fuel [2, 3]. The usage of biodiesel is reduces the emission of carbon monoxide (CO), hydrocarbons (HC) and particulate matter (PM). Biodiesel have same properties as same as diesel and it is a promising alternative fuel to diesel because of its properties and power output are same as diesel but slight decrease in the thermal efficiency [4]. Gutta crude oil using heterogeneous catalyst (CaO) by optimizing four process parameters. And the performance and emission characteristics test is conducted in CI engine by using biodiesel blends B20, B40, B60, B80, and of 92.7% is achieved by using CCD of RSM in an optimum condition at molar ratio 9:1 by using 0.8% of catalyst concentration in 45 min of reaction time at 500C temperature. Whereas predicated yield at 94.14%. The biodiesel produced from the GG at optimum onditions satisfies the relevant quality standards. The experimental evaluation of performance and emission characteristics of the biodiesel blends prepared by using GG biodiesel. The blends are prepared by preparing the blends of B20, B40, B60, B80, and 100.The performance and emission characteristics of blends are compared with the diesel. The performance parameters such as BP, BTE, and SFC are observed. There is a small reduction of BP for all the blends 6.65% reduction of BTE for B20. The fuel ion of B20, B40, and B60 is decreased by 9.67%. The emission of CO, HC and smoke opacity is decreased whereas CO2 and NOX are slightly (2013)[3] in this paper author given edible vegetable oils and seeds. Also author investigated the critical evaluation of oil extraction, biodiesel production, characteristics and performance and emission productions by the engine. T.M Ynus Khan et.al, (2014)[6] in this paper authors are reviewed that the necessity and edible seeds and oils over edible oils and seeds. They identified the emerging technologies to produce the biodiesel. Using edible r biodiesel production leading to economic effect in the countries therefore authors suggested the Keywords: Optimization; RSM; Transesterification; CaO nano catalyst; Garcinia Gummi-Gutta Optimization; RSM; Transesterification; Gutta 1.INTRODUCTION Nowadays, the utilization of conventional fuels like petroleum, coal and natural gas are increasing in the petroleum, coal and natural gas are increasing in the Gwi-Taek et.al, (2009)[7] Nowadays, the utilization of conventional fuels like published about optimization of transesterification of @ IJTSRD | Available Online @ www.ijtsrd.com @ IJTSRD | Available Online @ www.ijtsrd.com | Volume – 2 | Issue – 4 | May-Jun 2018 Jun 2018 Page: 1919
International Journal of Trend in Scientific Research and Development (IJTSRD) ISSN: 2456-6470 parameters methanol to ratio, temperature and catalyst concentration. They achieved 97.8±6% of yield of biodiesel from animal fat at methanol to oil ratio is 7.5:1, temperature is 65°C with 20min of reaction time. Predicted yield value given by the CCD using RSM is 98.6%. B.R. Omkaresh et.al, (2016)[8] investigated about optimization of Annona Squamosa oil biodiesel production using response surface methodology. Central composite rotatable design of RSM is used to determine 30 optimum conditions by considering four variable parameters Molar ratio, catalyst amount, reaction time and temperature. The maximum yield of Annona Squamosa methyl ester is found at molar ratio of 6.98:1 by using 1.22% of catalyst wt% in 35.35min of reaction time at 53.27°C of temperature. Gaurav Dwivedi et.al, (2015)[9] authors investigated about optimization of biodiesel yield from Pongamia oil and its stability and application of Box-Behnken design for optimization process. Authors achieved 98.4% of yield of Pongamia methyl ester at methanol to oil (11.06:1) using catalyst KOH (1.43%) in 81.43 min of time at 56.6°C. also author investigated improvement of oxidation stability. Chinyere B. Ezekannaghha et.al, (2017)[10] in this paper author is used CCD of RSM to optimization of the methanolysis of lard oil in the production of biodiesel. They considered four parameters molar ratio, time, catalyst amount and temperature to achieve maximum yield of lard B100. They achieved 96.2% of biodiesel yield at an optimum condition given by the CCD of RSM.Milan D Kostic et.al, (2016)[1] In this paper author is used PKSB (Palm Kernel Shell Biochar) to produce CaO Catalyst with a size of 1 µm to 100 µm and it was calcinated at 8000C for 2 hours under atmospheric pressure immediately before use. Activation energy of catalyst is 108.8kJ/mol. He used CaO as a heterogeneous catalyst for the production of biodiesel from sunflower oil by taking molar ratio 9:1 to 15:1 and temperature ranges from 450 to 650, catalyst loading 3 to 7 wt%. Using RSM method he found that best biodiesel production can be done at molar ratio is 9:1 temperature is 650C and catalyst load at 3wt%. Z. Helwani et.al, (2009)[11] In this paper they investigated that what are the advantages and disadvantages of using heterogeneous catalyst over homogeneous catalyst heterogeneous catalyst gives higher yield than homogenous catalyst.S B Arun et.al, (2017)[12] In this paper author investigated that the biodiesel production by using calcinated CaO and Na3PO4 as a heterogeneous base catalyst. Properties of biodiesel found and compared with different catalyst. They concluded that CaO and Na3PO4 are suitable heterogeneous catalyst for production of biodiesel as it can be recycled and reused. Surbhi Semwal et.al, (2011)[13] In this paper they surveyed that the production of heterogeneous homogeneous catalyst for the production of biodiesel and their effect on the yield of the biodiesel by using heterogeneous catalyst as base catalyst. Bhaskor J Bora et.al, (2016)[14] They investigated performance, combustion and emission characteristics of a dual fuel (rice bran bio diesel and biogas) to run the variable compression ratio in CI Engine with three difference compression ratio such as 18, 17.5 and 17 at with a fixed injection timing 230 BTDC under different load conditions. They founded that 17.67% and 17.18% emission reduction in CO and HC. When compression is increased from 17 to 18 and increased in N and Carbon dioxide by 42.85% and 14.13 respectively. K Sivaramakrishnan, (2017)[4] The author investigated and compared performance and emission characteristics of Karanja Biodiesel when fueled at 20%, 25% and 30% with conventional diesel. Experiment has been conducted at 15, 16, 17 and 18:1. The evaluation is done by optimization process by using RSM. The overall optimum results are found for 25% biodiesel –blended conventional diesel at engine C.R 18:1. 2.Materials and method 2.1Materials CaO nano catalyst and methanol was purchased from NANOSHEL, Intelligent Derabassi, Punjab, India. GG seeds are collected from the Southern part of Karnataka. Mechanical expeller is used to extract the oil from the GG seeds. The GG oil was characterized to determine the acid value, viscosity, saponification value, iodine value and calorific value. catalyst with on about the Materials Pvt. Ltd. 2.2Experimental methods 2.2.1Transesterification process The higher value of FFA present in the oil requires first stage of transesterification process to reduce the FFA content in the oil. In this stage 250ml of Methanol and 10-12ml of H2SO4 is added to 1L of GG Crude Oil in 3 neck flask and stirred with 600rpm at 60℃ for 2hr, it is poured in to separating flask. In the separating flask top layer contains excess of H2SO4 and Methanol, in the bottom layer esterified oil is settled whose FFA value is reduced less than 2%. That esterified oil is used for second stage of and how the @ IJTSRD | Available Online @ www.ijtsrd.com | Volume – 2 | Issue – 4 | May-Jun 2018 Page: 1920
International Journal of Trend in Scientific Research and Development (IJTSRD) ISSN: 2456-6470 transesterification process. The percentage of yield is calculated by using Eq (1) Final FFA Initial yeild 2.3Design experiments The optimization process is used to increase the biodiesel yield% from crude oils. Optimization process is carried out by using Response Surface Methodology (RSM). The effect of four parameters on the yield of GG biodiesel is evaluated by using RSM. RSM is based on the four independent parameters and five level central composite rotatable designs (CCRD). The biodiesel production from the GG crude oil transesterification is examined by considering the four different independent parameters as follows Molar Ratio (A, Methanol to oil ratio), Catalyst (B, wt%), Reaction Time (C, min) and Temperature (D, °C). The CCRD is appended with 16 factorial points (24=16), six central points and eight star points totally 30 experimental readings are given by the software to allocate information about the interior of the experimental part, allowing for the estimation of the curvature. The selected independent parameters involve coded and un-coded levels, independent parameters, and experimental part as shown in the Table 1. FFA 100 % Eq ) 1 ( Initial FFA Second stage of transesterification is carried out when the FFA value is less than 2%. In this stage Synthesis of Biodiesel is carried out for the higher yield of biodiesel. Synthesis of biodiesel is done by using 3 neck flask in this 100ml of esterified oil is poured and preheated up to 60℃. For this process required amount of Methanol and CaO nano particle is added to esterified oil. After this process sample is transferred into separating flask. In separating flask three layers are formed in upper layer GG methyl ester is formed, in middle layer glycerol and finally in lower layer CaO nano particles are settled. The percentage of GGME (Garcinia Gummi-Gutta Methyl Ester) is calculated by using Eq (2). GGME of Amount yeild ( ml ) % 100 Eq ) 2 ( Amount of Esterified Sample ( ml ) Second stage of transesterification is carried out when the FFA value is less than 2%. In this stage Synthesis of Biodiesel is carried out for the higher yield of biodiesel. Synthesis of biodiesel is done by using 3 neck flask in this 100ml of esterified oil is poured and preheated up to 60℃. For this process required amount of Methanol and CaO nano particle is added to esterified oil. After this process sample is transferred into separating flask. In separating flask three layers are formed in upper layer GG methyl ester is formed, in middle layer glycerol and finally in lower layer CaO nano particles are settled. The percentage of GGME (Garcinia Gummi-Gutta Methyl Ester) is calculated by using Eq (2). 2.4Model fitting The RSM was used to carry out all experimental values taken by the central composite rotatable design. Using Design Expert 11.0 software is used for the statistical analysis and graphical analysis of the data. The experimental yield values are analyzed with the RSM using the polynomial Eq (3)[8]. 4 4 3 4 2 i y x x x x Eq ) 3 ( 0 ii ii ii ij i j i 1 i 1 i 1 j i 1 Where: Y = Response factor, β0 = Intercept, βi = First order model coefficient, βii = Quadratic Co-efficient of factor i, βij = linear co-efficient for the interaction between i and j, xi = Independent parameter. 2.5Statistical analysis by using response surface methodology RSM is done by using Design Expert 11.0 Software, by Stat-Ease, Inc., USA. The experimental data given by the software is listed in the Table 2. The evaluation of optimum condition for the biodiesel yield is done by following steps: analysis of variance (ANOVA), regression analysis and response surface plots of the interaction effect of the parameters. ANOVA Test: it is a process which calculates the effect of linear, quadratic and linear interactive on the parameters of biodiesel yield. The p-value is used as basis to measure the significance coefficients; if the value of p is less than 0.05 and value of F within the level of 95% then the coefficient Amount of GGME ( ml ) % yeild 100 Eq ) 2 ( Amount of Esterified Sample ( ml ) 2.2.2Biodiesel characterization The physical, chemical and thermal properties like density, viscosity, flash point, cloud point, pour point, calorific value, saponification value and iodine value of GG crude oil are reduced after GGME production as per ASTM limits. All the properties are found by using standard procedure by using the laboratory equipments and chemicals; redwood viscometer, flash and fire point apparatus, cloud and pour point, bomb calorimeter etc… of the regression @ IJTSRD | Available Online @ www.ijtsrd.com | Volume – 2 | Issue – 4 | May-Jun 2018 Page: 1921
International Journal of Trend in Scientific Research and Development (IJTSRD) ISSN: 2456-6470 is significant otherwise it is not significant. To develop the mathematical model equation (Eq3) the response of the transesterification process is used and equation correlates the yield of biodiesel to the transesterification process parameter selected. Co- efficient of determination (R2) value gives the acceptability of the model by comparing with the Table 1. Parameters and their levels for CCRD of the GG oil transesterification Parameter Units Symbol Level -α 3 0.4 40 30 -1 5 0.8 50 45 0 7 1.2 60 60 +1 9 1.6 70 75 +α 11 2.0 80 90 - wt% Min °C A B C D Molar ratio Catalyst Reaction time Temperature Table 2. CCRD experimental and predicted value of GG biodiesel yield Run Molar Ratio (mol/mol) 5 5 11 5 7 7 9 7 9 5 7 7 9 9 7 5 9 9 7 9 5 7 7 9 3 5 7 5 7 7 Catalyst Conc. (wt%) 1.6 0.8 1.2 0.8 0.4 1.2 1.6 1.2 0.8 0.8 1.2 1.2 0.8 0.8 1.2 1.6 1.6 1.6 1.2 1.6 1.6 1.2 1.2 0.8 1.2 0.8 1.2 1.6 2 1.2 Temperature (°C) 50 70 60 50 60 60 70 40 50 70 60 60 50 70 60 70 50 70 80 50 50 60 60 70 60 50 60 70 60 60 Time (min) 45 45 60 75 60 30 45 60 75 75 60 60 45 75 90 45 45 75 60 75 75 60 60 45 60 45 60 75 60 60 GG Biodiesel Yield (%) Actual Value 82.9 82.1 79.2 81.4 91.5 85.1 85.7 83.3 83.3 92.4 85.4 84.4 92.7 88.3 84.6 82.9 90.0 86.7 91.1 80.0 78.1 84.8 84.3 86.5 74.7 83.0 84.5 91.4 89.2 84.6 Predicted Value 81.98 82.16 79.70 80.88 96.15 85.70 85.61 84.27 82.96 92.07 84.67 84.67 94.14 88.61 84.83 83.03 90.11 86.68 93.97 79.32 78.44 84.67 84.67 85.94 75.03 82.81 84.67 91.34 89.38 84.67 1 2 3 4 5 6 7 8 9 10 11 12 13 14 15 16 17 18 19 20 21 22 23 24 25 26 27 28 29 30 @ IJTSRD | Available Online @ www.ijtsrd.com | Volume – 2 | Issue – 4 | May-Jun 2018 Page: 1922
International Journal of Trend in Scientific Research and Development (IJTSRD) ISSN: 2456-6470 Table 3 Properties of GG biodiesel and ASTM limits Properties Unit GG Crude Oil 912 71 225 23 20 38.414 83.94 GG Biodiesel ASTM Limits 880 1.9-6.0 Min 130 -3 to -12 -15 to -16 - - 3 minimum - kg/m3 cSt °C °C °C MJ/kg g iodine/g mg KOH/g 202.18 % Density Kinematic viscosity @ 40 0C Flash point Cloud point Pour point Calorific value Iodine value Saponification value Free fatty acid 860 4.25 161 -2 1 41870 70.92 178.15 0.09 6.484 adjusted R2 value. The CCRD conditions and responses and experimental yield values and predicted yield values are contained in the Table 2. Optimization process is done to know the maximum biodiesel yield of the respective seeds or oils. Using this process we can find the time, methanol and catalyst wt% required to do the transesterification process for maximum yield of biodiesel. By conducting the experiments using experimental values given by the CCRD maximum yield can be found. For the optimization of the GG crude oil selected parameters levels are listed in Table 1. The various properties of the GG crude oil and biodiesel are found in laboratory by using the equipments as follows; Flash and Fire point by using Pensky Martens apparatus, Cloud and Pour point by using Cloud and Pour point apparatus, Table 4 Specification of diesel engine Rated Power Rated Speed Bore diameter (D) Stroke (L) Compression Ratio C.V of fuel for Diesel Density of Diesel 5.12 Kw 1500 rpm 87.5 mm 110 mm 17.5:1 42,500 kJ/kg 840 kg/m3 2.6 Performance and emission test The performance and emission test is carried out by using single cylinder four-stroke diesel engine connected to eddy current dynamometer for loading. The specification of engine and five gas analyzer is showed in Table 4 and Table 5. The water is supplied in water jackets of engine and calorimeter to reduce the increasing temperature of the engine. Pressure sensors and thermo couples are connected to the engine to measure pressure and temperature in the engine respectively. The engine set up is connected to the computerized system and engine analysis software is installed in computer. The computerized systems stores the all data from engine like load, fuel flow, air flow, water flow rate, temperatures, pressure, rpm of the piston and fuel consumption etc… By using all the data it calculates following performance parameter brake power, indicated power, total fuel consumption, brake mean effective pressure, brake specific fuel consumption, brake thermal efficiency, indicated thermal efficiency, volumetric mechanical efficiency etc…. Viscosity by using Red Wood Viscometer, Calorific Value by using Bomb Calorimeter, Iodine and Saponification values are found in chemistry labs. The characteristics of the GG biodiesel are compared with American Society for Testing and Materials Standards (ASTM). Table 5 Specification of gas analyzer Measurement Data Co – 0-15% Vol HC – 0-20000 ppm vol CO2 – 0 – 20% Vol O2 – 0 – 25% Vol NOx 0-6000 ppm Vol Resolution 0.0001% Vol 1 ppm/10ppm 0.1% Vol 0.01% Vol 1 ppm Vol The properties result in Table 3 shows the iodine and saponification values in the GG crude oil is reduced from 83.94 to 70.92and 202.18 to 178.15 respectively it shows that the iodine and saponification value is reduced after biodiesel production. The free fatty acid content in the GG crude oil is reduced from 6.482% to efficiency and 3 3.1Characterization Results and discussion @ IJTSRD | Available Online @ www.ijtsrd.com | Volume – 2 | Issue – 4 | May-Jun 2018 Page: 1923
0.09% after transesterification. The main significant factor of GG crude oil is viscosity. The results shown in the Table 3 the viscosity of the GG biodiesel is reduced after biodiesel production. The properties of the GG biodiesel are in compliance with the ASTM limits. three cross products coefficient AC, AD and CD are found significant. The ANOVA prepared a final equation in terms of coded factors of biodiesel yield is shown in Eq 3. The significance and acceptability of the model is also sophisticated by high value of coefficient of determination (R2) value of 0.9896 and adjusted determinant coefficient value of 0.9798 for developed correlation. The R2 value says that the model explains 98.96% of the total difference in the yield of biodiesel which is attributed to the experimental variables. The p value of the lack of fit is 1.1122 therefore it is insignificant; it is good for us because the model should be significant. 3.2Evaluation of regression model The relationship between the experimental process parameters and biodiesel yield is evaluated by using the central composite rotatable design (CCRD) modeling technique. Second order polynomial regression equation integral between response yield of biodiesel (Y) and the process variables; methanol/oil molar ratio (A), catalyst conc. (B), time (C) and temperature (D). Yield = 84.67 + 1.17A - 0.6917B + 1.67C - 0.2167 D -0.3000 AB - 1.39 AC - 1.81 AD + 0.4250 BC - 0.4000 BD + 2.96 CD - 1.82A2 +1.53B2 +07375C2 + 0.1500D2 Eq(3) Figure 1 shows the actual v/s predicted yield of the GG biodiesel correlation by graphical method. In that the most yield of the GG biodiesel is located in the range 80 to 95%,. Few yields are located at less than 80%. The experimental results of the response surface given the validating results to the predicted values where the Table 2 given the maximum validating biodiesel yield is 94.57 % at methanol to oil ratio is 6.049:1, catalyst concentration 0.62, temperature 65 °C and reaction time 83.5 min. 3.3Response surface plots to know effect of reaction parameters The 3D response curves are drawn to know the effect of the independent parameters; molar ratio, catalyst concentration, reaction time and temperature on the dependent factor biodiesel yield. The 3D graph is drawn by taking two independent parameters with dependent parameter yield. Figure 1 Actual value versus predicted value of biodiesel yield The ANOVA results showed in the Table 4. The value of p is less has 0.05 therefore the model is significant. The ANOVA suggested the suitable quadratic response surface model is shown in the Table 7. Select the highest order polynomial where the additional terms are significant and the model is not aliased. From Table 6 the three linear coefficients A, B and C, three quadratic coefficient A2, B2 and C2 and Above3D surface response plots shows variation of yield by taking two variable parameters. Figure 2 shows surface response plot of yield by varying temperature and molar ratio. In this plot the yield of GG biodiesel is increase @ IJTSRD | Available Online @ www.ijtsrd.com | Volume – 2 | Issue – 4 | May-Jun 2018 Page: 1924
International Journal of Trend in Scientific Research and Development (IJTSRD) ISSN: 2456-6470 Table 6 ANOVA for response surface quadratic model for GG biodiesel Sum of Squares Df Mean SquareF-value 541.31 14 38.66 A-molar ratio 32.67 1 B-catalyst 11.48 1 C-Temperature 67.33 1 D-Time 1.13 1 AB 1.44 1 AC 30.8 1 AD 52.56 1 BC 2.89 1 BD 2.56 1 CD 140.42 1 A² 91.35 1 B² 63.79 1 C² 14.92 1 D² 0.6171 1 Residual 5.7 15 Lack of Fit 5.1 15 Pure Error 0.7933 5 Cor Total 647.01 29 Std. Dev. : 0.6165; R²: 0.9896; Adjusted R²: 0.9798; Predicted R²:0.9462; C.V. %: 0.7242 Source p-value < 0.0001 < 0.0001 < 0.0001 0.0011 0.1057 0.0706 < 0.0001 < 0.0001 0.0147 0.0203 < 0.0001 < 0.0001 < 0.0001 < 0.0001 0.222 1.1122 Model 101.72 85.94 30.21 177.15 2.96 3.79 81.04 138.28 7.6 6.73 369.42 240.34 167.82 39.25 1.62 55.09 Significant not significant 32.67 11.48 67.33 1.13 1.44 30.8 52.56 2.89 2.56 140.42 91.35 63.79 14.92 0.6171 0.3801 0.4908 0.1587 Table 7 Sequential model sum of squares for GG biodiesel yield Sequential Model Sum of Squares [Type I] Sum Of Squares df Source Mean Square 2.17E+05 28.15 38.45 59.62 0.3331 0.4338 7266.49 F-value p-value Mean vs Total Linear vs Mean 2FI vs Linear Quadratic vs 2FI Cubic vs Quadratic 2.67 Residual Total 2.17E+05 112.61 230.68 158.02 1 4 6 5 8 7 30 0.2003 0.0151 < 0.0001 0.6428 Suggested Aliased 1.62 3.59 180.24 0.7679 3.04 2.18E+05 Figure 3 3D surface response plot of variation of yield with catalyst conc. and molar ratio Figure 2 3D surface response plot of variation of yield with temperature and molar ratio @ IJTSRD | Available Online @ www.ijtsrd.com | Volume – 2 | Issue – 4 | May-Jun 2018 Page: 1925
International Journal of Trend in Scientific Research and Development (IJTSRD) ISSN: 2456-6470 linearly with increasing temperature. There is no much variation in the yield by increasing molar ratio. The better reaction is taken at maximum temperatures. The maximum yield found at 9:1 of molar ratio and 50°C. Figure 3 shows the surface response plot of variation of yield by varying the CaO nano-catalyst and molar ratio. In this plot the dependent variable is decreased by increasing the independent variables (the yield of the GG biodiesel is decreased by increasing the catalyst concentration).But Figure 3 shows the yield is increased at minimum and maximum catalyst concentration. with increasing molar ratio. Figure 4 shows surface response plot of variation of yield by taking time and molar ratio. The dependent variable yield is increased when one of the independent variable keeping constant and by varying another independent variable. By increasing time and molar ratio decreases the yield. It is due to catalyst will get more expose at higher temperature and molar ratio which increases the glycerol and soap formation in the biodiesel yield. Figure 5 shows the surface response plot of variation of yield by varying temperature and catalyst by keeping molar ratio and time constant. From Figure it was observed that the CaO catalyst is exposed (activated) more at medium temperature. At lower temperature, catalyst will not get exposed. By increasing temperature, catalyst is not reacted with other independent variables. Figure 6 shows the surface response plot of variation of yield by varying time and catalyst concentration by keeping molar ratio and temperature constant. Catalyst need more time to expose (activate) therefore increase the time increases the yield. The plot also shows that the increasing the time increases yield. After optimum value of catalyst concentration decreases the yield. Figure 7 show that the surface responses plot of variation of yield by varying time and temperature by keeping molar ratio and catalyst concentration. Higher value of time and temperature gives the maximum yield it is due to the catalyst concentration needs more time and minimum temperature to expos. 4.Performance and emission test results and discussion 4.1Variation of brake power with load The brake power is nothing but power output of an engine. The viscosity and density of fuel plays major role brake power, higher viscosity and density of fuel causes in reduction in BP of engine [15]. From Figure 8 it was observed that there no much lower value of BP in B20, B40, B60, B80 and B100 compared to the non-renewable fuel diesel. The results showed that the BP of all the blends in the average value of 5.6% of BP is less compared to diesel at maximum load of a diesel engine. It is due to the higher value of viscosity and density, and lower calorific value. 4.24.2 Variation of brake thermal efficiency with load The brake thermal efficiency is the power output by an engine to the total input energy supplied to engine. The BTE nothing but how efficient the engine converts input chemical energy into mechanical work [4]. From Figure 9 shows that the BTE is increasing with increasing the load, it is because of the engine gives complete combustion under high load. In this test we observed that the BTE of B20, B40, B60, B80 and B100 at maximum load on engine is 6.69%, 6.64%, 6.21%, 5.84% and 14.93% lower than conventional fuel diesel respectively. The B100 gives higher BTE drop (14.23%) when compared with other blends to diesel. Figure 4 3D surface response plot of variation of yield with time and molar ratio Figure 5 3D surface response plot of variation of yield with temperature and catalyst conc. @ IJTSRD | Available Online @ www.ijtsrd.com | Volume – 2 | Issue – 4 | May-Jun 2018 Page: 1926
International Journal of Trend in Scientific Research and Development (IJTSRD) ISSN: 2456-6470 Load Effect on BP 6 5 B20 4 BP (kW) B40 3 B60 2 B80 1 B100 0 Diesel 0.05 4.51 9.01 13.51 18.01 Load (kg) Figure 8 Variation of BP by varying load Figure 6 3D surface response plot of variation of yield with time and catalyst conc. Load Effect on BTE 35 30 B20 25 BTE (%) B40 20 15 B60 10 B80 5 B100 0 Diesel 0.05 4.51 9.01 13.51 18.01 Load (kg) Figure 9 Variation of BTE by varying load 4.3 Variation of specific fuel consumption with load Figure 7 3D surface response plot of variation of yield with time and temperature Load Effect on SFC 3.5 The fuel consumption of an engine is a kilogram of fuel consumed to produce per unit of work done [5]. The Figure 10 shows that biodiesel fuel consumption at initial load is more compared to diesel, but at maximum load the B20, B40 and B60 has 9.67% of less consumption than diesel. The SFC of B20, B40, B60, B80, B100 and D100 is 0.28, 0.28, 0.28, 0.3, 0.32 and 0.31 respectively. At maximum load B100 showed more consumption because of its fuel properties higher density and viscosity and lower calorific value. 3 B20 2.5 B40 2 SFC 1.5 B60 1 B80 0.5 B100 0 DIESEL 0.05 4.51 9.01 13.5118.01 Load (kg) Figure 10 Variation of SFC by varying load 4.4 Variation of UBHC with respect to load The Figure 12 shows the variation of unburnt hydro carbon with the varying load. The UBHC is one of the emission product produced by the diesel engine [4]. The UBHC level is less in biodiesel compared to diesel. The UBHC @ IJTSRD | Available Online @ www.ijtsrd.com | Volume – 2 | Issue – 4 | May-Jun 2018 Page: 1927
International Journal of Trend in Scientific Research and Development (IJTSRD) ISSN: 2456-6470 from the biodiesel blends is less at low and medium load and it is increased at maximum load. It is due to rich mixture enters the combustion chamber which leads to improper combustion in the engine. The UBHC produced from B20, B40, B60, B80 and B100 is 9.67%, 14.51%, 20.96%, 25.8% and 32.25% is less compared to conventional fuel. Load Effect onCO2 12 10 B20 8 CO2 (%) B40 6 Load Effect on CO B60 4 B80 0.5 2 B100 0.4 B20 0 Diesel CO (%) 0.05 4.51 9.01 13.51 18.01 Load (kg) 0.3 B40 B60 0.2 B80 Figure 13 Variation of CO2 by varying load 0.1 B100 0 4.4Variation of NOx with respect to load Diesel 0.05 4.51 9.01 13.51 18.01 Load (kg) Load Effect on NOx 2500 Figure 11 Variation of CO by varying load 2000 B20 Load Effect on HC NOx(PPM) 1500 B40 70 B60 1000 60 B80 500 B20 50 HC (PPM) B100 B40 40 0 Diesel 0.05 4.51 9.01 13.51 18.01 Load (kg) 30 B60 20 B80 10 B100 Figure 14 Variation of NOx by varying load 0 Diesel The Figure 14 shows the variation of the NOx by varying the load. The higher the value of density of biodiesel results in higher NOx emission. The un- saturation level is more for lower cetane number of the fuels. It leads to the higher NOx emission. Figure 14 shows that increasing in load increase the NOx emission. The NOx emission is more in biodiesel compared to diesel. It is due to small amount of nitrogen present in vegeTable oils and oxygen present in the biodiesel. The B100 shows 6.72% more emission than diesel at maximum load. 0.05 4.51 9.01 13.51 18.01 Load (kg) Figure 12 Variation of UBHC by varying load 4.5 Variation of CO2 with respect to load The Figure 13 shows the variation of CO2 with varying load. The CO2 is a one of the emission product it forms when complete combustion takes place in the diesel engine. The CO2 forms when required amount of oxygen is present during the formation of CO as a combustion product [15]. In this test we can see that the CO2 formation is increasing with increasing in load. The CO2 formation from the biodiesel and its blends is more because small amount of oxygen is present in it. The B100 produced 4.16% of more CO2 than diesel. 4.7Variation of Opacity with respect to load Figure 15 shows the variation of the opacity with increasing load. The smoke opacity is nothing but solid soot’s particle present in the engine exhaust gas. At maximum load the smoke opacity of the B20, B40, B60, B80 and B100 is 7.7%, 16.35%, 27.83%, 11.21% and 7.16% lower than the diesel respectively. It may be because of viscosity of the fuels. @ IJTSRD | Available Online @ www.ijtsrd.com | Volume – 2 | Issue – 4 | May-Jun 2018 Page: 1928
International Journal of Trend in Scientific Research and Development (IJTSRD) ISSN: 2456-6470 found for B100 where as minimum of 9.67% for the B20. CO2 emission of the all the biodiesel blends is higher than the diesel. It is because of the small amount of the oxygen is present in the biodiesel. NOx emission of the biodiesel blends is increased. It is because of the higher value of density and viscosity of the biodiesel. Load Effect on Opacity 80 70 B20 60 Opacity (%) 50 B40 40 B60 30 20 B80 10 REFERENCES 1.Abhirup Bandyopadhyay, Optimization of evaporative extraction of natural emulsifier cum surfactant mukrossi-characterization and cost Industrial Crops and Products 77, 2015, pp. 920- 931 B100 0 Basu, Soham Ranjana Basu, Sujaya Diesel 0.05 4.51 9.01 13.51 18.01 Load (kg) Chowdhury, from sapindus analysis, Figure 15 Variation of opacity by varying load 5.Conclusion The production of biodiesel from Garcinia Gummi- Gutta crude oil is successfully completed. Optimal condition given by the CCD using RSM are satisfied the standards of the biodiesel. The maximum yield of 92.7% is achieved at an optimum condition of molar ratio 9:1 by using 0.8% of catalyst concentration in 45min of reaction time at 50°C of temperature. The predicted yield of the GG biodiesel was 94.14%. The actual yield 92.7% is within the limit of the predicted yield of optimum values. The produced biodiesel is blended with the diesel to run the diesel engine. The fuel properties of the biodiesel are found as per standards of biodiesel given by the America. Modification of the diesel engine is not required to run to use biodiesel as a fuel. 2.Rui Shan, Guanyi Chen, Beibei Yan, Jiafu Shi, Changye Liu, Porous CaO-based catalyst derived from PSS-induced mineralization for biodiesel production enhancement, Energy Conversion and Management 106,2015, pp. 405-413 3.A.E Atabani, A.S. Silitonga, H.C. Ong, T.M.I, Mahlia, H.H. Masjuki, Irfan Anjum Badruddin, H. Fayaz, Non edible vegetable oils: A critical evaluation of oil composition, biodiesel production, characteristic, engine performance and emissions production, Renewable and Sustainable Energy Reviews 18, 2013, pp. 211-245 extraction, fatty acid 4.K. Shivaramakrishnan, performance and emission characteristics of a variable compression multi fuel engine fuelled with karanja biodiesel-diesel blend, Egyptian Journal of Petroleum “ in press”2017 Investigation on The performance and emission characteristics of the blends of biodiesel from GG crude oil B20, B40, B60, B80 and B100 has been performed in a diesel engine at five different loads and compared with the diesel. Brake thermal efficiency of B20, B40, B60, B80 and B100 is found 6.69%, 6.64%, 6.21%, 5.84% and 14.93% lesser than diesel respectively. The minimum decrease of brake thermal efficiency is 5.84% for the B80. Specific fuel consumption of the blends is lesser than the diesel. The maximum decrease of 9.67% is found for the B20, B40 and B60. The maximum increase of 3.12% is found for the B100. CO emission of the B20, B40, B60, B80 and B100 is decreased 18.8%, 22.2% 16.22%, 10% and 28.88% compared to diesel respectively. The maximum decrease of 28.88% is found for the B100. UBHC emission of the all the blends is lesser than the diesel. The maximum decrease of 32.25% is 5.ShikhaGangil, YashwanthParihar, Modhera, Preparation of biodiesel by three step method followed purification by various silica sources, Materials Today : Proceedings 4, 2017, pp. 3636-3641 Chanchal VirendraDhakar, Mewar, Bharat 6.T.M. Yunus Khan, A. E. Atabani, Irfan Anjum Badruddin, Ahmad Badarudin, M.S. Khayon, S. Triwahyono, Recent scenario and technologies to utilize non-edible oils for biodiesel production, Renewable and Sustainable Energy Reviews 37, 2014, pp. 840-851 7.Gwi-Taek Jeong, Hee-Seung Yang, Don-Hee Park, Optimization of transesterification of animal @ IJTSRD | Available Online @ www.ijtsrd.com | Volume – 2 | Issue – 4 | May-Jun 2018 Page: 1929
International Journal of Trend in Scientific Research and Development (IJTSRD) ISSN: 2456-6470 fat ester using response surface methodology, Bioresource Technology 100, 2009, pp. 25-30 Optimization of evaporative extraction of natural emulsifier cum surfactant mukrossi-characterization and cost Industrial Crops and Products 77, 2015, pp. 920- 931 from sapindus analysis, 8.B. R. Omkaresh, R. Suresh & K.V. Yatish, Optimization of Annona suuamosa oil biodiesel production by using methodology, Taylor and Francis, Biofuels, 2016, “in press” ISSN: 1759-7269 response surface 18.Milan D. Kostic, Alireza Bazargan, Olivera S. Stamenkovic, Vlada B. Veljkovic, Gordon McKay, Optimization and kinetics of sunflower oil methanolysis catalyzed by calcium oxide- based catalyst derived from palm kernel shell biochar, Elsevier, Fuel 163, 2016 , pp. 304-313 9.Gaurav Dwivedi, M. P. Sharma, Application of box-behnken design in optimization of biodiesel yield from pongamia oil and its stability analysis, Fuel 145, 2015, pp. 256-262 19.Ivana B. Bankovic-Ilic, Marija R. Miladinovic, Olivera S. Stamenkovic, Vlada B. Veljkovic, Application of nano CaO based catalysts in biodiesel synthesis, Renewable and Sustainable Energy Reviews 72, 2017, pp. 746-760 10.Chinyere B. Ezekannagha, Callistus N. Ude, Okechukwu D. Onukwuli, Optimization of methanolysis of lard oil in the production of biodiesel with response surface methodology, Egyptian Journal of Petroleum 2017, “in press”. 20.Chinyere B. Ezekannagha, Callistus N. Ude, Okechukwu D. Onukwuli, Optimization of methanolysis of lard oil in the production of biodiesel with response surface methodology, Egyptian Journal of Petroleum, 2017, “in press” 11.Z. Helwani, M.R. Othman, N. Aziz, W. J. N. Fernando, J. Kim, Technologies for production of biodiesel focusing on green catalytic techniques- A review, Fuel Processing Technology 90, 2009, pp. 1502-1514 21.Ashok Kumar Yadav, Mohd Emran Khan, Amit Pal, Kaner biodiesel production through hybrid reactor and its performance testing on a CI engine at different compression ratios, Egyptian Journal of Petroleum, 2016, “in press” 12.S.B. Arun, R. Suresh, K.V. Yatish, B.R. Omkaresh, N. Chennakeshava Naik, Use of CaO and Na3PO4 catalysts in the synthesis of biodiesel and investigation of fuel properties, Materials Today- Proceedings 4, 2017, pp. 11111-11117 22.Y. Datta Bharadwaj, B. Govinda Rao, V. Dharma Rao, C. Anusha, Improvement of biodiesel methanol blends performance in a variable compression ratio engine using response surface methodology, Alexandria Engineering Journal, 2016, “in press” 13.Surbhi Semwal, Ajay K. Arora, Rajendra P. Badoni, Deepak K. Tuli, Biodiesel production using hetrogenous Technology 102, 2011, pp. 2151-2161 catalyst, Bioresource 14.Bhaskhor J. Bora, Ujjwal K. Saha, Experimental evaluation of rice bran biodiesel-biogas run dual fuel diesel engine at varying compression ratios, Renewable Energy 87, 2016, pp. 782-790 23.Chinta Reddy Venkat Reddy, Reed Oshel and John G. Verkade, Room-temperature conversion of soybean oil and poultry fat to biodiesel catalyzed by nanocrystalline calcium oxide, Energy & Fuels 20, 2006, pp. 1310-1314 15.Ankur Nalgundawar, Biswajit Paul, Sunil Kumar Sharma, Comparison of performance and emission characteristics of DI CI engine fueled with dual biodiesel blends of palm and jatropha, Fuel, 2016 “in press”. 24.T. Yusaf, I. Hmawand, P. Baker and G. Najafi, The effect of methanol-diesel blended ratio on CI engine performance, IJAME, Volume 8, ISSN 2229-8649, 2013, pp. 1385-1395 16.Dilip Kumar Bora, D. C. Baruah, L.M. Das, M K. G. Babu, Performance of diesel engine using biodiesel obtained from mixed feedstocks, Renewable and Sustainable Energy Reviews 16, 2012, pp. 5479-5484 25.Harsha Hebbar H R, M C Math, Yatish K V, Optimization and kinetic study of CaO nano- particles catalyzed biodiesel production from bombax ceiba oil, Energy, 2017, EGY 11762 17.Abhirup Bandyopadhyay, Basu, Soham Ranjana Basu, Sujaya Chowdhury, @ IJTSRD | Available Online @ www.ijtsrd.com | Volume – 2 | Issue – 4 | May-Jun 2018 Page: 1930